Difference between revisions of "Mpetredi Week 8"
From LMU BioDB 2013
(→Part 2: added screenshot of work and more lab journal entries) |
(→MAPPFinder Procedure: more lab journal entries) |
||
| Line 175: | Line 175: | ||
===MAPPFinder Procedure=== | ===MAPPFinder Procedure=== | ||
| + | #Open MAPPFinder from Programs or within GenMAPP by going to Tools/MAPPFinder. | ||
| + | #Click on Calculate New Results, and MAPPFinder will automatically detect the color set GEX file created previously. Hit OK. | ||
| + | #Select a criteria to filter by (for class purposes, I selected "Decreased" | ||
| + | |||
| + | |||
| + | |||
| + | |||
{{Individual Assignment Categories}} | {{Individual Assignment Categories}} | ||
Revision as of 17:41, 17 October 2013
Contents |
Mitchell Petredis
[[Team Name]]
Relevant Documents
- Excel Spreadsheet of Merrel Compiled Raw Data Vibrio (from class)
- Text Document of Merrel Compiled raw Data Vibrio (from class)
References
Lab Journal
Part 1
- Note: all of these events occurred after the introductory lab on October 10, 2013. Any instructions prior to the ones below can be found in the sections above "Sanity Check: Number of genes significantly changed" at the OpenWetWare link above, which was followed word for word without any issues, with the exception of the equation "=TDIST(ABS(R2),degrees of freedom,2" under the section "Perform statistical analysis on the ratios" which was properly changed to "=TDIST(ABS(Q2),degrees of freedom,2" in order to fix an error message in Excel.
- Open Excel Document and in Microsoft Excel 2010 for PC, look at the top menu bar and navigate to Data/Filter. Small arrows should now appear to the right of every cell on the top row.
- Find the "Pvalue" column, click on the first cell labeled "Pvalue", and click on the small downward facing arrow to the right of the cell text. A list of options will open in a small window next to the cell.
- Clicking on the "Number Filters" option will open a window adjacent to the option, with another list of options to choose from. Select "Custom Filter..."
- A new dialog box appears with two scroll-down boxes and two circle checks; by default, the first scroll-down box is labeled "equals" with nothing appearing in the second scroll-down box, and the circle "And" is marked instead of "Or". Click on the "equals" box and change it to "is less than", and to the right of that type in "0.05" in the text box. #*Clicking "OK" will then only display Pvalues less than 0.05 and also changes the downward facing arrow icon to the right of "Pvalues" to a smaller downward facing arrow and a filter icon, indicating that the filter is active. Notice the information at the bottom left of the Excel program that tells us how many values match that of less than 0.05 (in this example, 948 of 5221 records fit the criteria we set).
- Repeat the steps in #2 for Pvalues < 0.01, 0.001, and 0.0001.
- Results for other Pvalues
- <0.01; 235/5221
- <0.001; 24/5221
- <0.0001; 2/5221
- Results for other Pvalues
- Repeat the steps in #2 for Pvalues < 0.01, 0.001, and 0.0001.
- "When we use a p value cut-off of p < 0.05, what we are saying is that you would have seen a gene expression change that deviates this far from zero less than 5% of the time."
- Replace 0.05 with 0.01, 0.001, 0.0001 to get better certainty of data results.
- Change Pvalue filter back to 0.05, and add a filter to AvgLogFC_all to display results greater than 0.
- Results display 352/5221 records
- Keep Pvalue filter set to 0.05, but change AvgLogFC_all filter to display results less than 0.
- Results display 596/5221 records
- Keep Pvalue filter set to 0.05, but change AvgLogFC_all filter to display results greater than 0.25.
- Results display 339/5221 records
- Keep Pvalue filter set to 0.05, but change AvgLogFC_all filter to display results less than -0.25
- Results display 579/5221 records
- Merrel used the Statistical Analysis for Microarrays (SAM) program and organized her data by determining which genes were deferentially regulated (237 genes), induced (44 genes), and repressed (193). I could not find any mention of Pvalues or other similar aspects of data throughout the paper, and therefore could not quite compare Merrel's results to my results.
Part 2
- Launch GenMAPP from Programs
- Download and extract appropriate gene database file to the Downloads folder. For this assignment, I will use this one: [Vc-Std_External_201001022.zip]
- From the extracted zip file, place the Vc-Std_External_201001022.gdb file into C:\GenMAPP 2 Data\Gene Databases
- From GenMAPP, look at the menu bar and navigate to Data/Choose Gene Database, which will prompt to locate the file from step 3. Select it and click open.
- Now that the database is loaded, go to Data/Expression Dataset Manager, and select the text file located at mpetredi Week 8 that I made last Thursday (download it if you don't have it already). Open the text file.
- Another prompt will appear asking to check off boxes that have text data in a column. There's no text in any columns, so ignore this and continue.
- After this step, the program ran and I got an error message from Raw Data File Conversion, saying that "121 errors were detected in your raw data." My partner Gabriel obtained 772 errors with an older version of the database, probably because the newer database is more refined and accurate than the other one.
- A new text file was created from my original text file, but now with the file extension EX.txt. Open it in Excel and go to Data/Filter.
- Scroll all the way to the right to find an errors column, and click on the filter icon to the right of the first cell in the errors column. Only have "Gene not found in OrderedLocusNames" checked off.
- The following errors were discovered in these Gene IDs, going down the list from AutoFilter:
- VC2209
- VC2209
- VCA1031
- VCA0745
- VC1476
- VCA0534
- VCA0276
- VCA0276
- VC1660
- VC2209
- VC2209
- VCA0449
- VCA0745
- VC1759
- VCA0534
- VCA0276
- VCA0276
- VCA0280
- VC1018
- VC1307
- VC1513
- VC2049
- VC2049
- VC2338
- VC2338
- VCA0596
- VC0500
- VC0518
- VC0521
- VC0793
- VC1620
- VC1620
- VC1620
- VC1625
- VC1625
- VC1018
- VC1307
- VC1513
- VC1513
- VC1807
- VC2209
- VC2049
- VC2338
- VC2338
- VCA0596
- VCA0358
- VC0499
- VC0501
- VC0518
- VC0521
- VC0793
- VC0793
- VC0818
- VC1620
- VC1620
- VC1620
- VC1625
- VC1625
- VCA0133
- VC0284
- VC0284
- VC0583
- VC0607
- VC1660
- VC2209
- VC2209
- VCA0454
- VCA1031
- VCA1031
- VCA1036
- VCA1073
- VCA1073
- VCA0232
- VCA0232
- VC0663
- VC2209
- VCA1089
- VCA1104
- VC0284
- VC0284
- VC0583
- VC0607
- VC1395
- VC1660
- VC2209
- VC2209
- VC2209
- VCA1031
- VCA1036
- VCA1073
- VCA1073
- VCA0232
- VC1476
- VCA1089
- VCA1104
- VC1807
- VC2109
- VCA0596
- VCA0887
- VC1620
- VC1620
- VC1620
- VC2437
- VC2700
- VC2700
- VCA0674
- VCA0692
- VCA0938
- VC1018
- VC2109
- VCA0887
- VC0254
- VC0518
- VC1620
- VC1620
- VC2437
- VC2700
- VC2700
- VC2700
- VCA0674
- VCA0692
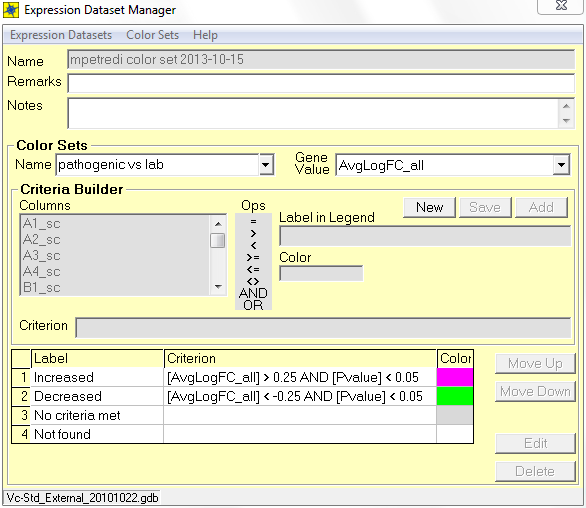
- In GenMAPP, create a new color set by going to Data/Expression Dataset Manager/Expression Datasets/New, and supply a name for it (mine is mpetredi color set 2013-10-15). The file will be created with the extension ".gex" at the end of it.
- Supply a name in the "Color Sets" box (I chose pathogenic vs lab)and select "AvgLogFC_all" from the drop-down box for "Gene Value"
- Click on "New" under the "Gene Value" drop-down menu to start building functions for the MAPP. Fill in the information as seen in this picture:
- Save your progress by going to Expression Datasets/Save in the menu bar.

MAPPFinder Procedure
- Open MAPPFinder from Programs or within GenMAPP by going to Tools/MAPPFinder.
- Click on Calculate New Results, and MAPPFinder will automatically detect the color set GEX file created previously. Hit OK.
- Select a criteria to filter by (for class purposes, I selected "Decreased"