Dwilliams Project Notebook
From LMU BioDB 2013
Contents |
Week 12
Electronic Lab Notebook Week 12
- Transferring Raw Data into Excel Sheet
- Went to the Arrayexpress website and downloaded all of the microarray raw data.
- Proceeded to upload all of the microarray raw data onto team wiki page.
- I also opened the raw data in an excel spreadsheet and begin determining gene ID's and future formatting for the statistical analysis that we will perform on our species next week.
- Reflection
- What were the week’s key accomplishments?
- We worked efficiently and effectively in our group when preparing the powerpoint presentation. As an individual, I worked on uploading the microarray data to the team page.
- What are next week’s target accomplishments?
- Next week I would like to finish our formatting of the microarray data and begin our statistical analysis.
- What team strengths were seen this week?
- We worked well as a group and held a good level of communication with each other throughout the process.
- What team weaknesses were seen this week?
- We weren't as organized as we could have been, although I think that this is something that we will definitely improve upon in the future.
Week 13
Electronic Lab Notebook Week 13
- Downloaded Affymetrix software from dChip web site.
- Saved Affymetrix software into downnloads on desktop of computer (front row, 3 over from the right).
- Clicked on tutorial hyperlink from dChip web site.
- Opened "dChip expression data analysis" word doc.
- Begin following steps from word doc.:
- Obtained dChip and Microarray Data
- Downloaded and unzipped Microarray Data from ArrayExpress website.
- Specifically, Raw Data Zipped File (Found on team page).
- Basic steps to open expression data
- Created New folder on desktop titled "dChip Analysis".
- Unzipped folder by using 7zip "Unpack Here" option.
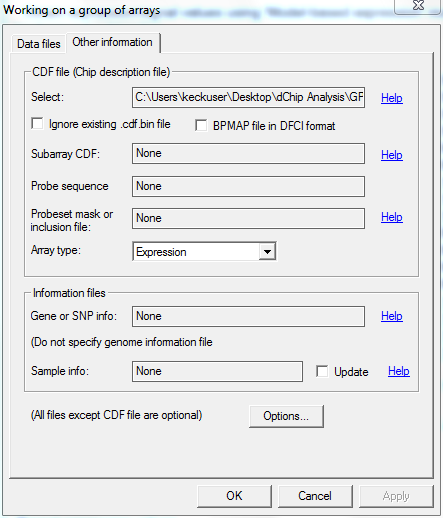
- Placed .cdfin file in folder to run dChip.exe
- Opened dChip software.
- Clicked "Analysis"-->"Open Group".
- Specified data directory as CEL file.
- Selected working directory in "Options".
- Selected following specifications and ran dChip:

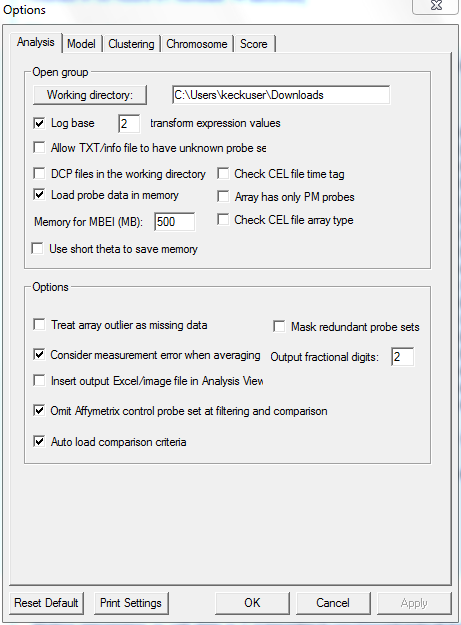
- Select analysis--> Normalize and Model Data
- Process each graph and hit "ok".
- Tools-->"Export Expression Value"
- Select all expression values-->run program-->find where file is saved.
- Open file in .xls format-->name file "Master Spreadsheet".
- Renaming Columns in Master Spreadsheet
- Access sdrf file (found on team page).
- Save link as.
- Open using excel spreadsheet.
- Match gene ID's to gene ID's found in Master Spreadsheet columns to rename the number sequences with meaningful titles; e.g. "Gene expression data from_RB grown in axenic media + rifampicin rep 4"
- Separate into 5 groups.
- Find average of each group.
- Perform TTEST ((=TTEST(rangegroup1,rangegroup2,2,3))
- Find EB to RB without rifampicin.
- Find EB to RB with rifampicin.
- Find Log Value (EB/RB) with/without rifampicin.
- Issues with Creating Master Excel Spreadsheet
- Matched gene ID's from sdrf sheet to rename columns with meaningful titles.
- Found that there were exactly 2 versions of every single gene ID in the raw data but not in the sdrf sheet.
- Gene ID + Gene ID with "SE" at the end.
- Found that "SE" denoted "standard error"
- Deleted all duplicate "standard error" columns.
- Could not do EB to RB with/without rifampicin for every rep. because there weren't matching files for every single rep.
- Took Logbase 2 EB to RB for every rep. that had a matching rep. with/without rifampicin (=Log(Column1/Column2,2)).
- Created new page in excel master sheet titled "EB to RB Values".
- Copied all information from excel sheet where forumlae were ran to obtain data, pasted-->special-->values only.
- Saved sheet as Final Master Spreadsheet.


Electronic Lab Notebook Week 13 11/24/2013
- Met with Dahlquist during office hours.
- Created new excel spread sheet file with all of the raw data imported into one sheet named "dChip_2_signal1".
- Created new sheet and copy/pasted all of the raw data into the sheet and named it "edited_raw_data".
- Deleted all columns containing the P/A sequences as well as all the repeat "SE (standard error)" columns.
- Consulted sdrf file in order to find the EB/RB columns that did not contain rifampicin.
- Created new sheet titled "EB-to-RB".
- Copied all of the probe set data into column A.
- Copied all of the columns not containing rifampicin into columns B-G.
- EB was B-C. RB was D-G.
- Named column H "AverageEB" -- Found average of EB.
- Named column I "AverageRB" -- Found average of RB.
- Named column J "EB-to-RB" -- Took average of EB/Average of RB.
- Named column K "LogFC_EB-to-RB" -- Took log of EB to RB (column J).
- Formula: [=LOG(J2,2)]
- Named column L "P value".
- Ran ttest.
- Created new sheet named "EB-to-RB_Rifampicin".
- Repeated process with the columns containing rifampicin.