Difference between revisions of "Lenaolufson Week 15"
From LMU BioDB 2015
Lenaolufson (Talk | contribs) (added the electronic notebook for formatting the file for GenMAPP) |
Lenaolufson (Talk | contribs) (→12/8/15: added in protocol for sanity check) |
||
| Line 1: | Line 1: | ||
==12/8/15== | ==12/8/15== | ||
| − | *It was now time for me to prepare my file for GenMAPP, and I did so by the | + | *It was now time for me to prepare my file for GenMAPP, and I did so by the [http://www.openwetware.org/wiki/BIOL398-01/S10:Sample_Microarray_Analysis_Vibrio_cholerae ''Vibrio cholerae'' instructions found here.]] |
* I inserted a new worksheet and named it "forGenMAPP". | * I inserted a new worksheet and named it "forGenMAPP". | ||
* I went back to the "statistics" worksheet and Selected All and Copied. | * I went back to the "statistics" worksheet and Selected All and Copied. | ||
| Line 14: | Line 14: | ||
** [[File:Bpertussis CompiledRawData MS2015-3.xlsx]] | ** [[File:Bpertussis CompiledRawData MS2015-3.xlsx]] | ||
** [[File:Bpertussis CompiledRawData MS2015-3.txt]] | ** [[File:Bpertussis CompiledRawData MS2015-3.txt]] | ||
| + | * Then it was time to perform a sanity check, which was done using the [http://www.openwetware.org/wiki/BIOL398-01/S10:Sample_Microarray_Analysis_Vibrio_cholerae ''Vibrio cholerae'' instructions found here.]] | ||
| + | * I opened my spreadsheet and went to the "forGenMAPP" tab. | ||
| + | * I clicked on cell A1 and selected the menu item Data > Filter > Autofilter. Little drop-down arrows appeared at the top of each column. This enabled me to filter the data according to criteria I set. | ||
| + | * I clicked on the drop-down arrow on my "Pvalue" column. I selected "Custom". In the window that appeared, I set a criterion that filtered my data so that the Pvalue was less than 0.05. | ||
| + | **p-value less than 0.05: 1923/3552, 54% | ||
| + | **p-value less than 0.01: 1028/3552, 29% | ||
| + | **p-value less than 0.001: 242/3552, 7% | ||
| + | **p-value less than 0.0001: 40/3552, 1% | ||
| + | **p < 0.05 for the Bonferroni-corrected p value: 9/3552, 0.2% | ||
| + | **p < 0.05 for the Benjamini and Hochberg-corrected p value: 1365/3552, 38% | ||
| + | *Keeping the (unadjusted) "Pvalue" filter at p < 0.05, I filtered the "Avg_ABC_Samples" column to show all genes with an average log fold change greater than zero. | ||
| + | **964/3552, 27% | ||
| + | *Keeping the (unadjusted) "Pvalue" filter at p < 0.05, I filtered the "Avg_ABC_Samples" column to show all genes with an average log fold change less than zero. | ||
| + | **959/3552, 27% | ||
| + | *With an average log fold change of > 0.25 and p < 0.05 | ||
| + | **874/3552, 25% | ||
| + | *With an average log fold change of < -0.25 and p < 0.05 | ||
| + | **848/3552, 24% | ||
| + | * the fold change cut-off of greater than 0.25 or less than -0.25 and the unadjusted p value cut off of p < 0.05 | ||
| + | **1722/3552, 48% | ||
| − | |||
| − | |||
| − | |||
| − | |||
| − | |||
| − | |||
| − | |||
| − | |||
| − | |||
| − | |||
| − | |||
| − | |||
| − | |||
| − | |||
| − | |||
| − | |||
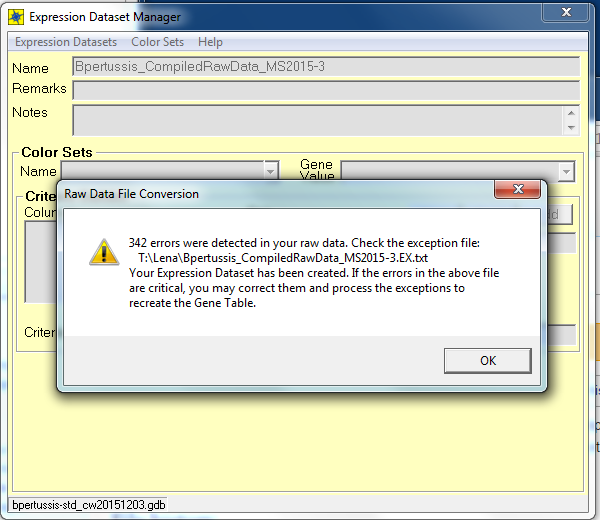
*numbers of errors found when running the .txt file in the GenMAPP database: 342 errors | *numbers of errors found when running the .txt file in the GenMAPP database: 342 errors | ||
*23 replacements for the #DIV/0! | *23 replacements for the #DIV/0! | ||
Revision as of 21:29, 10 December 2015
12/8/15
- It was now time for me to prepare my file for GenMAPP, and I did so by the Vibrio cholerae instructions found here.]
- I inserted a new worksheet and named it "forGenMAPP".
- I went back to the "statistics" worksheet and Selected All and Copied.
- I went to my new sheet and clicked on cell A1 and selected Paste Special, clicked on the Values radio button, and clicked OK.
- I then deleted the ID columns besides the far left one in column A, and I deleted the second MasterIndex column because it was unnecessary.
- I added a "1" before all of the titles of columns D through I so that none of the columns would have the same names due to the replicates.
- I selected Columns V through Y (all the fold changes). I selected the menu item Format > Cells. Under the number tab, I selected 2 decimal places. I clicked OK.
- I selected all the columns containing p values. I selected the menu item Format > Cells. Under the number tab, I selected 4 decimal places. I clicked OK.
- I deleted the left-most Bonferroni p value column, preserving the one that showed the result of my "if" statement.
- I inserted a column to the right of the "ID" column. I typed the header "SystemCode" into the top cell of this column. I filled the entire column (each cell) with the letter "N".
- I selected the menu item File > Save As, and chose "Text (Tab-delimited) (*.txt)" from the file type drop-down menu.
- After preparing it for GenMAPP, here are the .xls and .txt files:
- Then it was time to perform a sanity check, which was done using the Vibrio cholerae instructions found here.]
- I opened my spreadsheet and went to the "forGenMAPP" tab.
- I clicked on cell A1 and selected the menu item Data > Filter > Autofilter. Little drop-down arrows appeared at the top of each column. This enabled me to filter the data according to criteria I set.
- I clicked on the drop-down arrow on my "Pvalue" column. I selected "Custom". In the window that appeared, I set a criterion that filtered my data so that the Pvalue was less than 0.05.
- p-value less than 0.05: 1923/3552, 54%
- p-value less than 0.01: 1028/3552, 29%
- p-value less than 0.001: 242/3552, 7%
- p-value less than 0.0001: 40/3552, 1%
- p < 0.05 for the Bonferroni-corrected p value: 9/3552, 0.2%
- p < 0.05 for the Benjamini and Hochberg-corrected p value: 1365/3552, 38%
- Keeping the (unadjusted) "Pvalue" filter at p < 0.05, I filtered the "Avg_ABC_Samples" column to show all genes with an average log fold change greater than zero.
- 964/3552, 27%
- Keeping the (unadjusted) "Pvalue" filter at p < 0.05, I filtered the "Avg_ABC_Samples" column to show all genes with an average log fold change less than zero.
- 959/3552, 27%
- With an average log fold change of > 0.25 and p < 0.05
- 874/3552, 25%
- With an average log fold change of < -0.25 and p < 0.05
- 848/3552, 24%
- the fold change cut-off of greater than 0.25 or less than -0.25 and the unadjusted p value cut off of p < 0.05
- 1722/3552, 48%
- numbers of errors found when running the .txt file in the GenMAPP database: 342 errors
- 23 replacements for the #DIV/0!
- 339 errors with new .txt file
- links to files created:
- File:Bpertussis CompiledRawData MS2015-3.EX.txt
- File:Bpertussis CompiledRawData MS2015-3.xlsx
- File:Bpertussis CompiledRawData MS2015-3.txt
- File:Bpertussis CompiledRawData MS2015-3.gex
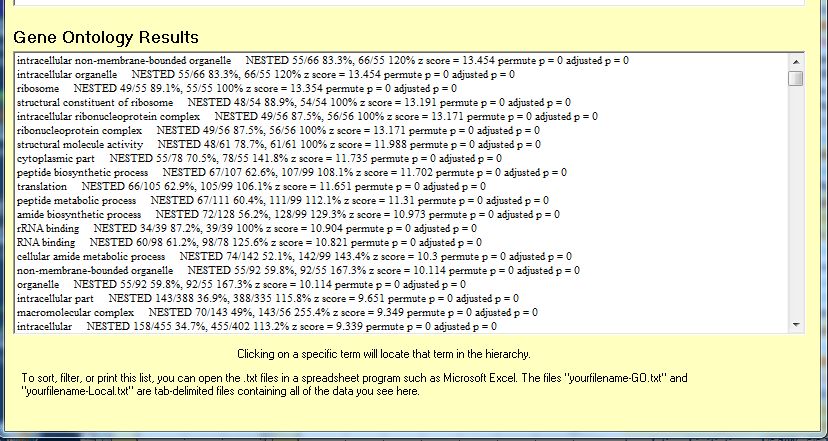
- Media:MAPPFinder results for geneontologyresultsCriterion1-GOtxt.png
- Media:Gene ontology results.png
- Media:Errors in GenMAPP.png