File:Bklein7 Week7 Question1.png
From LMU BioDB 2015
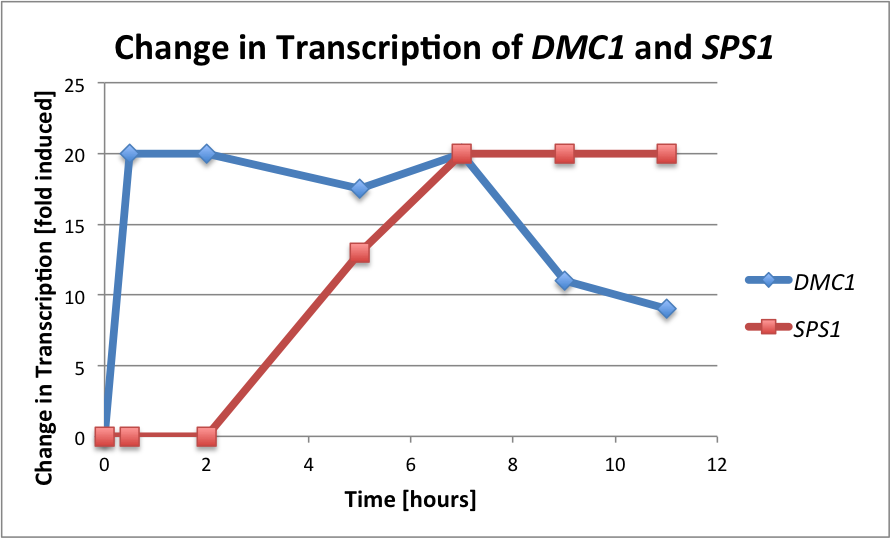
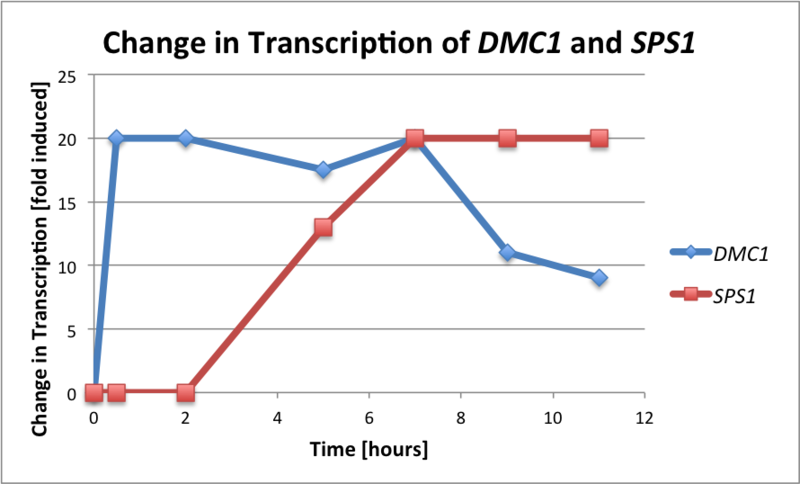
Revision as of 00:58, 19 October 2015 by Bklein7 (Talk | contribs) (Graph of changing transcription rates over time for two genes (answer to question 1 for the week 7 assignment))
Size of this preview: 800 × 484 pixels. Other resolution: 320 × 193 pixels.
Original file (890 × 538 pixels, file size: 67 KB, MIME type: image/png)
Graph of changing transcription rates over time for two genes (answer to question 1 for the week 7 assignment)
File history
Click on a date/time to view the file as it appeared at that time.
| Date/Time | Thumbnail | Dimensions | User | Comment | |
|---|---|---|---|---|---|
| current | 00:58, 19 October 2015 | | 890 × 538 (67 KB) | Bklein7 (Talk | contribs) | Graph of changing transcription rates over time for two genes (answer to question 1 for the week 7 assignment) |
- You cannot overwrite this file.
File usage
There are no pages that link to this file.