Ebachour Week 6
Contents
Assigned Questions: Discovery Questions from Chapter 4
Answer the following questions related to Chapter 4 of Campbell & Heyer (2003). Note that some of the questions below have been reworded from the Discovery Questions in the book:
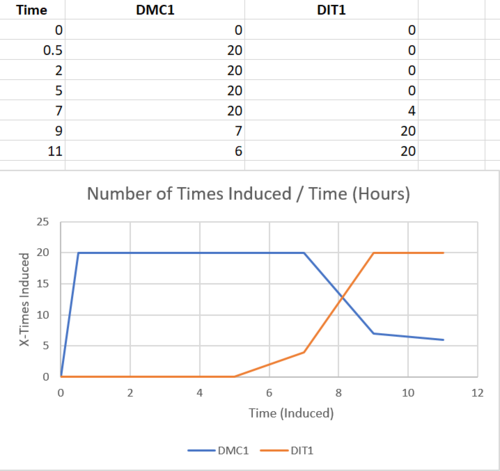
- (Question 5, p. 110) Choose two genes from Figure 4.6b (PDF of figures on Brightspace) and draw a graph to represent the change in transcription over time. Create your plot in Excel (or other program that can do plots) and display the image up on your wiki page. Alternately, you can do it by hand, scan or take a photo of the plot, and display the image on your wiki page.
- (Question 6b, p. 110) Look at Figure 4.7, which depicts the loss of oxygen over time and the transcriptional response of three genes. These data are the ratios of transcription for genes X, Y, and Z during the depletion of oxygen. Using the color scale from Figure 4.6, determine the color for each ratio in Figure 4.7b. (Use the nomenclature "bright green", "medium green", "dim green", "black", "dim red", "medium red", or "bright red" for your answers.)
- (Question 7, p. 110) Were any of the genes in Figure 4.7b transcribed similarly? If so, which ones were transcribed similarly to which ones?
- (Question 9, p. 118) Why would most spots be yellow at the first time point? I.e., what is the technical reason that spots show up as yellow - where does the yellow color come from? And, what would be the biological reason that the experiment resulted in most spots being yellow?
- (Question 10, p. 118) Go to the Saccharomyces Genome Database and search for the gene TEF4; you will see it is involved in translation. Look at the time point labeled OD 3.7 in Figure 4.12, and find the TEF4 spot. Over the course of this experiment, was TEF4 induced or repressed? Hypothesize why TEF4’s change in expression was part of the cell’s response to a reduction in available glucose (i.e., the only available food).
- (Question, 11, p. 120) Why would TCA cycle genes be induced if the glucose supply is running out?
- (Question 12, p. 120) What mechanism could the genome use to ensure genes for enzymes in a common pathway are induced or repressed simultaneously?
- (Question 13, p. 121) Consider a microarray experiment where cells deleted for the repressor TUP1 were subjected to the same experiment of a timecourse of glucose depletion where cells at t0 (plenty of glucose available) are labeled green and cells at later timepoints (glucose depleted) are labeled red. What color would you expect the spots that represented glucose-repressed genes to be in the later time points of this experiment?
- (Question 14, p. 121) Consider a microarray experiment where cells that overexpress the transcription factor Yap1p were subjected to the same experiment of a timecourse of glucose depletion where cells at t0 (plenty of glucose available) are labeled green and cells at later timepoints (glucose depleted) are labeled red. What color would you expect the spots that represented Yap1p target genes to be in the later time points of this experiment?
- (Question 16, p. 121) Using the microarray data, how could you verify that you had truly deleted TUP1 or overexpressed YAP1 in the experiments described in questions 8 and 9?
My Answers
-
-
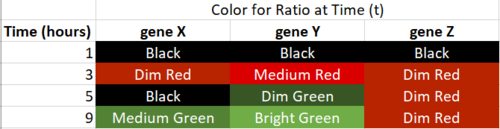
- Based on the given table, as well as the colored table pictured above, it seems that gene X & Y were transcribed similarly because they were very close in value and followed the same pattern of black, to some number of folds induced, and then to the opposite spectrum, having some folds repressed.
- Yellow in this case is the same thing as black. Black was used to represent that there was neither induction or repression, but in the real life experiment, there would be green dye and red dye in the same container, neither of them overpowering the other, which would leave somewhat of a yellow hue until there was activity (induction or repression). So this "yellow" color is just the mix of red and green dye.


At the first time point, most of the spots would be yellow because there hasn't been any change either towards induction or repression. Therefore the ratio of green to red dye in cells is relatively equal to begin. The actual reason why the spot is yellow is because when you combine red and green you get yellow. Biologically, if the experiment resulted in most spots being yellow this would infer genes were neither suppressed or induced in the experiment and genes were relatively unchanged in expression.
Acknowledgements
I worked with my homework partner Antonio Porras in class. We met face-to-face one time outside of class. We texted outside of class, working on the journal assignment questions together.
While I worked with the people noted above, this individual journal entry was completed by me and not copied from another source.
Ebachour (talk) 16:49, 9 October 2017 (PDT)
References
- LMU BioDB 2017. (2017). Week 6. Retrieved August 29, 2017, from https://xmlpipedb.cs.lmu.edu/biodb/fall2017/index.php/Week_6
- Alberts et al. (2002) Molecular Biology of the Cell, Ch. 8: Microarrays
- Microarray animation
- Brown, P.O. & Botstein, D. (1999) Exploring the new world of the genome with DNA microarrays Nature Genetics 21: 33-37.
- Campbell, A.M. and Heyer, L.J. (2003), “Chapter 4: Basic Research with DNA Microarrays”, in Discovering Genomics, Proteomics, and Bioinformatics, Cold Spring Harbor Laboratory Press, pp. 107-124. (Available on Brightspace)
- DeRisi, J.L., Iyer, V.R., and Brown, P.O. (1997) Exploring the Metabolic and Genetic Control of Gene Expression on a Genomic Scale. Science 278: 680-686.
Assignment Pages
- Week 1
- Week 2
- Week 3
- Week 4
- Week 5
- Week 6
- Week 7
- Week 8
- Week 9
- Week 10
- Week 11
- Week 12
- Week 14
- Week 15
Journal Entries
- Journal Week 2
- Journal Week 3
- Journal Week 4
- Journal Week 5
- Journal Week 6
- Journal Week 7
- Journal Week 8
- Journal Week 9
- Journal Week 10
- Journal Week 11
- Journal Week 12
- Journal Week 14
- Journal Week 15
Shared Journal Entries
- Shared Journal Week 1
- Shared Journal Week 2
- Shared Journal Week 3
- Shared Journal Week 4
- Shared Journal Week 5
- Shared Journal Week 6
- Shared Journal Week 7
- Shared Journal Week 8
- Shared Journal Week 9
- Shared Journal Week 10
- Shared Journal Week 11
- Shared Journal Week 12
- Shared Journal Week 14
- Shared Journal Week 15