File:GRNsight Regulation Magnitude Visualization of 15-gene 44-edge teamJASPAR Sigmoid estimation.PNG
From LMU BioDB 2017

Size of this preview: 800 × 500 pixels. Other resolutions: 320 × 200 pixels | 1,021 × 638 pixels.
Original file (1,021 × 638 pixels, file size: 129 KB, MIME type: image/png)
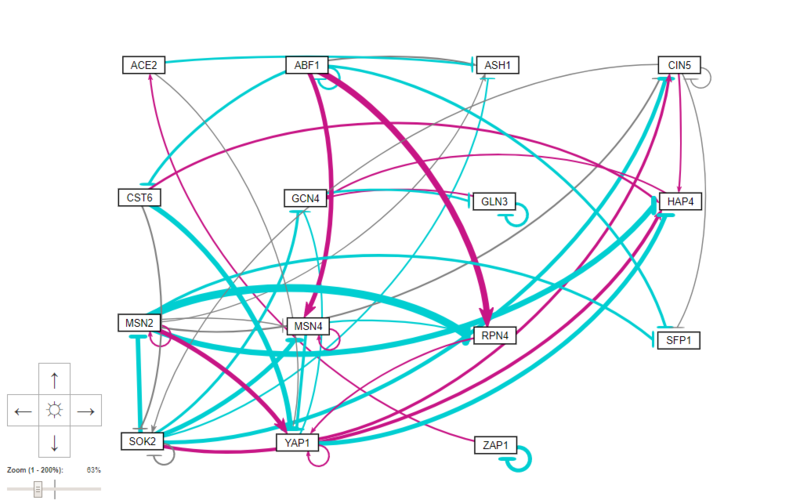
GRNsight visualization of file "15-gene_44-edge_teamJASPAR_Sigmoid_estimation_output.xlsx" to visualize regulation network with magnitude. The nodes were ordered alphabetically.
File history
Click on a date/time to view the file as it appeared at that time.
| Date/Time | Thumbnail | Dimensions | User | Comment | |
|---|---|---|---|---|---|
| current | 21:41, 9 December 2017 | | 1,021 × 638 (129 KB) | Aporras1 (talk | contribs) | GRNsight visualization of file "15-gene_44-edge_teamJASPAR_Sigmoid_estimation_output.xlsx" to visualize regulation network with magnitude. The nodes were ordered alphabetically. |
- You cannot overwrite this file.
File usage
The following page links to this file: