Difference between revisions of "Imacarae Week 6"
Jump to navigation
Jump to search
(→Acknowledgements: added 2 bullets and signed) |
(→References: added 3 bullets) |
||
| Line 45: | Line 45: | ||
==References== | ==References== | ||
| + | *Reading material and questions by Campbell, A.M. and Heyer, L.J. (2003), “Chapter 4: Basic Research with DNA Microarrays”, in Discovering Genomics, Proteomics, and Bioinformatics, Cold Spring Harbor Laboratory Press, pp. 107-124. Retrieved October 8, 2019 from Brightspace. | ||
| + | *TEF4 Background by SGD. (2019), TEF4/YKL081W Overview, in Saccharymyces Genome Database. Retrieved October 8, 2019 from [[https://www.yeastgenome.org/locus/S000001564 https://www.yeastgenome.org/locus/S000001564]]. | ||
| + | *Assignment by LMU BioDB 2019. (2019). Week 6. Retrieved October 8, 2019 from [[https://xmlpipedb.cs.lmu.edu/biodb/fall2019/index.php/Week_6 https://xmlpipedb.cs.lmu.edu/biodb/fall2019/index.php/Week_6]]. | ||
[[Category: Journal Entry]] | [[Category: Journal Entry]] | ||
Revision as of 23:42, 8 October 2019
Template
Purpose
- To learn what a DNA microassay is and to understand its relevance in various scientific fields.
- To form a basic overview of how this is used in research so that we may employ similar techniques in our own research design.
Discovery Questions
- (Question 5, p. 110) Choose two genes from Figure 4.6b (PDF of figures on Brightspace) and draw a graph to represent the change in transcription over time.
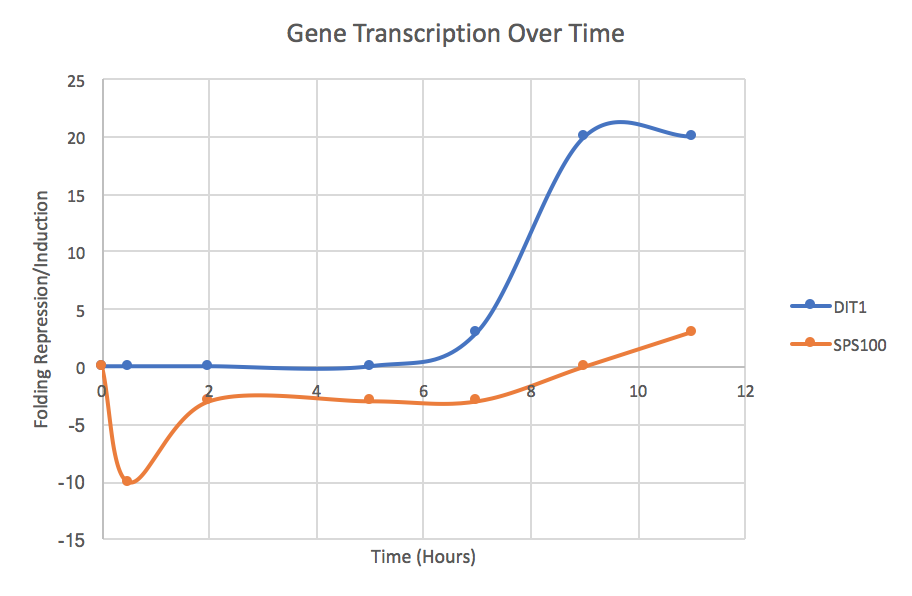
- This is the transcription for genes DIT1 and SPS100.
- A dip below the x-axis shows folding regression, while a rise above the x-axis shows in folding induction.
- (Question 6b, p. 110) Look at Figure 4.7, which depicts the loss of oxygen over time and the transcriptional response of three genes. These data are the ratios of transcription for genes X, Y, and Z during the depletion of oxygen. Using the color scale from Figure 4.6, determine the color for each ratio in Figure 4.7b. (Use the nomenclature "bright green", "medium green", "dim green", "black", "dim red", "medium red", or "bright red" for your answers.)
- Gene X
- - 1 hour: black
- - 3 hour: bright red
- - 5 hour: black
- - 9 hour: dim green
- Gene Y
- - 1 hour: black
- - 3 hour: bright red
- - 5 hour: dim green
- - 9 hour: bright green
- Gene Z
- - 1 hour: black
- - 3 hour: medium red
- - 5 hour: bright red
- - 9 hour: bright red
- Gene X
- (Question 7, p. 110) Were any of the genes in Figure 4.7b transcribed similarly? If so, which ones were transcribed similarly to which ones?
- Yes, genes X and Y were transcribed similarly.
- (Question 9, p. 118) Why would most spots be yellow at the first time point? I.e., what is the technical reason that spots show up as yellow - where does the yellow color come from? And, what would be the biological reason that the experiment resulted in most spots being yellow?
- Most spots would be yellow at the first time point because this is the point in which the genes are being transcribed as two transcriptomes. The color comes from both equal amount of red and green tags.
- (Question 10, p. 118) Go to the Saccharomyces Genome Database and search for the gene TEF4; you will see it is involved in translation. Look at the time point labeled OD 3.7 in Figure 4.12, and find the TEF4 spot. Over the course of this experiment, was TEF4 induced or repressed? Hypothesize why TEF4’s change in expression was part of the cell’s response to a reduction in available glucose (i.e., the only available food).
- TEF4 was repressed.
- TEF4's change in expression was most likely repressed in the absence of glucose so that cellular function can be focussed on other needed areas. Without glucose, cells have limited amounts of available energy, so it will conserve energy and use it in areas or functions where it is most needed. The transcription of TEF4 was most likely not one of these needed areas.
- (Question, 11, p. 120) Why would TCA cycle genes be induced if the glucose supply is running out?
- The TCA, or Citric Acid Cycle, genes would be induced if glucose supply is running out because this cycle makes helps make ATP in the absence of glucose and oxygen. The cell would need to transcribe genes to encode for molecules that assist in this process so the organism can function.
- (Question 12, p. 120) What mechanism could the genome use to ensure genes for enzymes in a common pathway are induced or repressed simultaneously?
- (Question 13, p. 121) Consider a microarray experiment where cells deleted for the repressor TUP1 were subjected to the same experiment of a timecourse of glucose depletion where cells at t0 (plenty of glucose available) are labeled green and cells at later timepoints (glucose depleted) are labeled red. What color would you expect the spots that represented glucose-repressed genes to be in the later time points of this experiment?
- (Question 14, p. 121) Consider a microarray experiment where cells that overexpress the transcription factor Yap1p were subjected to the same experiment of a timecourse of glucose depletion where cells at t0 (plenty of glucose available) are labeled green and cells at later timepoints (glucose depleted) are labeled red. What color would you expect the spots that represented Yap1p target genes to be in the later time points of this experiment?
- (Question 16, p. 121) Using the microarray data, how could you verify that you had truly deleted TUP1 or overexpressed YAP1 in the experiments described in questions 8 and 9?

Acknowledgements
- To my Homework Partner, Iliana Crespin. We met during class and briefly discussed the assignment.
- Except with what is noted above, this individual journal entry was completed by me and not copied from another source.
Imacarae (talk) 23:36, 8 October 2019 (PDT)
References
- Reading material and questions by Campbell, A.M. and Heyer, L.J. (2003), “Chapter 4: Basic Research with DNA Microarrays”, in Discovering Genomics, Proteomics, and Bioinformatics, Cold Spring Harbor Laboratory Press, pp. 107-124. Retrieved October 8, 2019 from Brightspace.
- TEF4 Background by SGD. (2019), TEF4/YKL081W Overview, in Saccharymyces Genome Database. Retrieved October 8, 2019 from [https://www.yeastgenome.org/locus/S000001564].
- Assignment by LMU BioDB 2019. (2019). Week 6. Retrieved October 8, 2019 from [https://xmlpipedb.cs.lmu.edu/biodb/fall2019/index.php/Week_6].