Difference between revisions of "Sulfiknights DA Week 14"
(→Merge completed databases into a single database) |
(→Conclusion) |
||
| Line 88: | Line 88: | ||
==Conclusion== | ==Conclusion== | ||
| − | The data analysis performed produced various graphs showing expression trends and networks that depicted regulation between genes. | + | The data analysis performed produced various graphs showing expression trends and networks that depicted regulation between genes. The network illustrating gene regulation for profiles 9 and 23 suggests RAP1 is highly regulated during exposure to sulfate and the network illustrating gene regulation for profiles 40 and 48 suggest both MSN2 and MSN4 are highly regulated during exposure to sulfate. |
==References== | ==References== | ||
Revision as of 17:42, 7 December 2019
| Sulfiknight Links | |||||||||
|---|---|---|---|---|---|---|---|---|---|
| BIOL Databases Main Page | Sulfiknights: Project Overview Page | Final Project Deliverables Requirements | Sulfiknights: Final Project Deliverables | Members | Project Manager & Quality Assurance: Naomi Tesfaiohannes | Quality Assurance: Joey Nimmers-Minor | Data Analysis: Ivy-Quynh Macaraeg & Marcus Avila | Designer: DeLisa Madere | |
| Assignment Pages | Week 11 | Week 12/13 | Week 15 | ||||||
Contents
- 1 Purpose
- 2 Methods and Results
- 3 Data and Files
- 3.1 Excel Spreadsheet with ANOVA Results/STEM Formatting
- 3.2 PowerPoint of ANOVA Table
- 3.3 Gene List and GO List files
- 3.4 YEASTRACT "Rank by TF" Results
- 3.5 GRNmap input workbook
- 3.6 GRNmap output workbook and output plots
- 3.7 MS Access database
- 3.8 Query design for populating a GRNmap input workbook from the database
- 3.9 Merge completed databases into a single database
- 4 Conclusion
- 5 References
- 6 Acknowledgements
Purpose
- To analyze data collected by Thorsen et al. regarding gene expression changes in response to sulfate exposure through using an ANOVA, running STEM, YEASTRACT, GRNsight, GRNmap, and Microsoft Access
- To check the efficacy of the work done by Thorsen et al.
Methods and Results
Loading Data into STEM
- Downloaded all STEM software needed found on Week 9.
- Deleted the "1080" data column from the "swtVnwt_1mM_stem" sheet found in the Thorsen Data Excel File.
- This was done so that the profile graphs were clearer
- Converted this file into a .txt file
- Ran STEM with this file under these parameters:
- No normalization/add 0
- Spot IDs included in the data file
- Browse: gene_association.sgd.gz
- Selected "X-axis scale should be: Based on real time" in the Interface Options on the All STEM Profiles (1) pop-up window.
- All genelists and GOlists for the significant profiles (9,23,40, and 48) were downloaded and saved as .txt files.
- Profiles 9 and 23 were colored red to show clusters that were involved in down-regulation.
- Profiles 40 and 48 were colored green to show clusters that were involved in up-regulation.
Creating regulatory networks with YEASTRACT
- Copied the gene lists from Profile 9 and 23.
- Inputted this list into the YEASTRACT database and under the "Rank by TF".
- Took the first 17 significant transciption factors and put them into both boxes of the Generate Regulation Matrix page.
- CSV file that was generated was converted into an Excel file.
- File was delimited and organized so that "p"s were deleted, everything was captalized, and the regulatees and regulators were alphabetized and in the same order.
- Position A1 was changed to the text: "rows genes affect/cols genes controlling".
- We deleted transcription factors that were not connected to others and/or only connected to itself.
- Sheet was named "network", saved, and inputted into the GRNsight home page.
Steps 1-7 were repeated with the genes from Profiles 40 and 48. In the end, we had two networks and two GRNsight matrices (black and white).
Data and Files
Excel Spreadsheet with ANOVA Results/STEM Formatting
Thorsen Data (Updated 12/2/19)
PowerPoint of ANOVA Table
PowerPoint of ANOVA table and Screenshots of STEM Profile Results
Profiles 9 and 23 input network (Excel)


Profile 40 and 48 input network (Excel)


Gene List and GO List files
Zipped Gene Lists for Significant Profiles
Zipped GOLists for Significant Profiles
YEASTRACT "Rank by TF" Results
GRNmap input workbook
GRNmap Input Worksheet: Profiles 9 and 23 GRNmap Input Worksheet: Profiles 40 and 48
GRNmap output workbook and output plots
GRNmap Output Files: Profiles 9 and 23
GRNmap Output Files: Profiles 40 and 48
MS Access database
MS Access Database of Thorsen & Dahlquist data
Query design for populating a GRNmap input workbook from the database
Profiles 9 and 23:


Profiles 40 and 48:


Merge completed databases into a single database
BIOL_478_Sulfiknights_BioDB_CombinedDatabase.zip
Access_Database_Schema_Screenshot.PNG
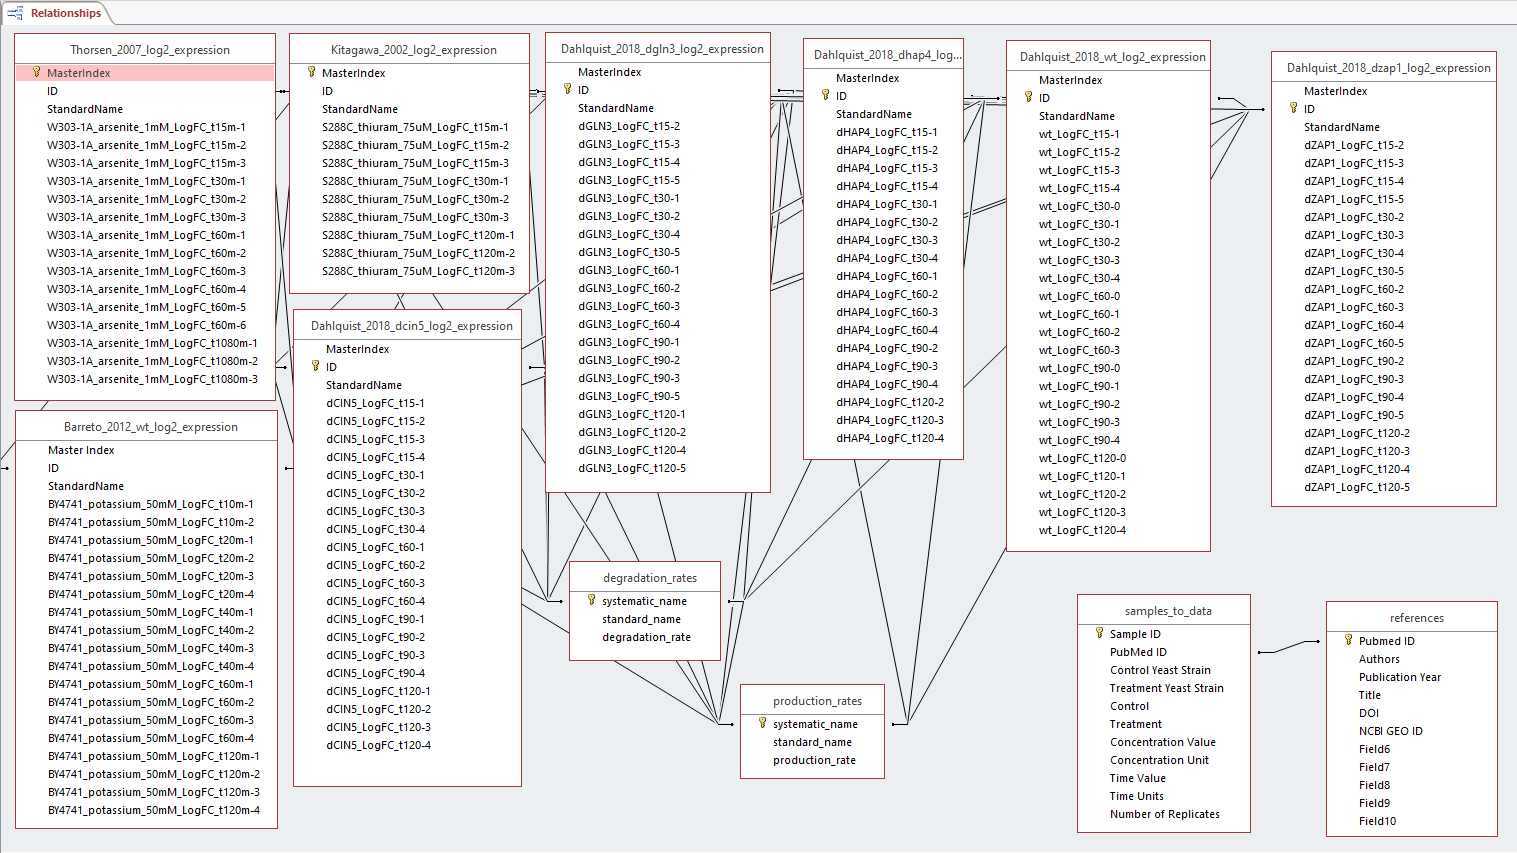
Conclusion
The data analysis performed produced various graphs showing expression trends and networks that depicted regulation between genes. The network illustrating gene regulation for profiles 9 and 23 suggests RAP1 is highly regulated during exposure to sulfate and the network illustrating gene regulation for profiles 40 and 48 suggest both MSN2 and MSN4 are highly regulated during exposure to sulfate.
References
- GRNsight. Retrieved December 3, 2019, from https://dondi.github.io/GRNsight/ .
- Short Time-series Expression Miner (STEM). Retrieved November 26, 2019, from http://www.cs.cmu.edu/~jernst/stem/ .
- Thorsen, M., Lagniel, G., Kristiansson, E., Junot, C., Nerman, O., Labarre, J., & Tamás, M. J. (2007). Quantitative transcriptome, proteome, and sulfur metabolite profiling of the Saccharomyces cerevisiae response to arsenite. Physiological genomics, 30(1), 35-43. DOI: https://doi.org/10.1152/physiolgenomics.00236.2006
- Week 9. Retrieved November 26, 2019, from https://xmlpipedb.cs.lmu.edu/biodb/fall2019/index.php/Week_9 .
- YEASTRACT. Retrieved December 3, 2019, from http://www.yeastract.com/formregmatrix.php .
Acknowledgements
We would like to thank User:Kdahlquist for helping with this investigation. Except for what is noted above, this individual journal entry was completed by the member of team Sulfiknights and not copied from another source.