Sulfiknights Deliverables
Jump to navigation
Jump to search
| Sulfiknight Links | |||||||||
|---|---|---|---|---|---|---|---|---|---|
| BIOL Databases Main Page | Sulfiknights: Project Overview Page | Final Project Deliverables Requirements | Sulfiknights: Final Project Deliverables | Members | Project Manager & Quality Assurance: Naomi Tesfaiohannes | Quality Assurance: Joey Nimmers-Minor | Data Analysis: Ivy-Quynh Macaraeg & Marcus Avila | Designer: DeLisa Madere | |
| Assignment Pages | Week 11 | Week 12/13 | Week 15 | ||||||
Contents
- 1 Checklist:
- 2 Group Report
- 3 Individual Statements of Work, Assessments, Reflections
- 4 Group Powerpoint Presentation
- 5 Excel Spreadsheet with ANOVA Results/STEM Formatting
- 6 PowerPoint of ANOVA Table...
- 7 Gene List and GO List files
- 8 YEASTRACT "Rank by TF" Results
- 9 GRNmap input workbook
- 10 GRNmap output workbook and output plots
- 11 MS Access database
- 12 ReadMe
- 13 Query design for populating a GRNmap input workbook from the database
- 14 Electronic notebook corresponding to the microarray results files
- 15 Merge completed databases into a single database
- 16 Final Reflection
Checklist:
- Organized Team deliverables wiki page (or other media (CD or flash drive) with table of contents) INCOMPLETE
- Group Report (.doc, .docx or .pdf file) INCOMPLETE
- Individual statements of work, assessments, reflections (wiki page, .doc, .docx, .pdf, or e-mailed to Dr. Dahlquist)INCOMPLETE
- Group PowerPoint presentation (given on Tuesday, December 10, .ppt, .pptx or .pdf file) INCOMPLETE
- Excel spreadsheet with ANOVA results/stem formatting (.xlsx) COMPLETE
- PowerPoint of ANOVA table, screenshots of stem results (.pptx), screenshot of black and white GRNsight input network and colored GRNsight output networks COMPLETE
- Gene List and GO List files from each significant profile (.txt compressed together in a .zip file) COMPLETE
- YEASTRACT "rank by TF" results (.xlsx) COMPLETE
- GRNmap input workbook (with network adjacency matrix, .xlsx) COMPLETE
- GRNmap output workbook (.xlsx) and output plots (.jpg) zipped together COMPLETE
- MS Access database, unified by the three teams with expression tables and metadata table(s) created (.accdb) COMPLETE
- ReadMe for the database that describes the design of the database, references the sources of the data, and has a database schema diagram (.doc, .docx, .pdf) INCOMPLETE
- Query design for populating a GRNmap input workbook from the database (screenshot of MS Access, or SQL code, .txt) COMPLETE
- Electronic notebook corresponding to these the microarray results files (Week 12/13 and Week 15) to support reproducible research so that all manipulations of the data and files are documented so that someone else could begin with your starting file, follow the protocol, and obtain your results. INCOMPLETE
Group Report
Individual Statements of Work, Assessments, Reflections
Group Powerpoint Presentation
Excel Spreadsheet with ANOVA Results/STEM Formatting
Thorsen Data (Updated 12/2/19)
PowerPoint of ANOVA Table...
PowerPoint of ANOVA table and Screenshots of STEM Profile Results
Profiles 9 and 23 input network (Excel)


Profile 40 and 48 input network (Excel)


Gene List and GO List files
Zipped Gene Lists for Significant Profiles
Zipped GOLists for Significant Profiles
YEASTRACT "Rank by TF" Results
GRNmap input workbook
GRNmap Input Worksheet: Profiles 9 and 23
GRNmap Input Worksheet: Profiles 40 and 48
GRNmap output workbook and output plots
GRNmap Output Files: Profiles 9 and 23
GRNmap Output Files: Profiles 40 and 48
MS Access database
MS Access Database of Thorsen & Dahlquist data
ReadMe
Query design for populating a GRNmap input workbook from the database
Profiles 9 and 23:


Profiles 40 and 48:


Electronic notebook corresponding to the microarray results files
Electronic notebook for Data Analysts:
Electronic notebook for Quality Assurance
Electronic notebook for Designer
Merge completed databases into a single database
BIOL_478_-_Sulfiknights_BioDB_CombinedDatabase.zip
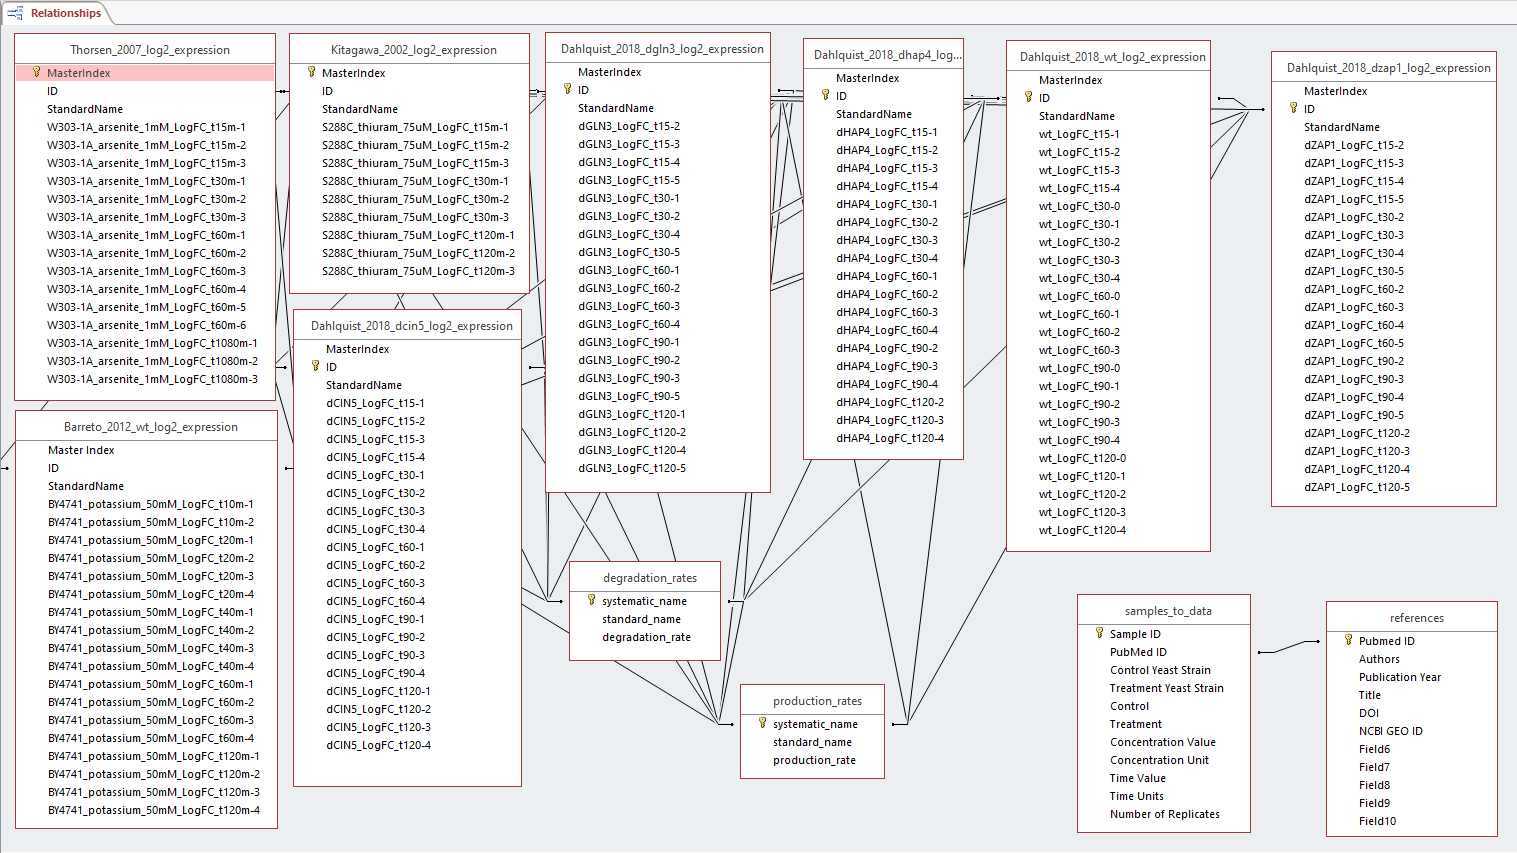
Access_Database_Schema_Screenshot.PNG
Final Reflection
Marcus Avila's Final Reflection
Individual Assessment and Reflection
Statement of Work
- Describe exactly what you did on the project.
- For the project I worked with Ivy to decide how to organize the Thorsen data to run an ANOVA. After running the ANOVA we went on to
- Provide references or links to artifacts of your work, such as:
- Wiki pages
- Other files or documents
- Code or scripts
Assessment of Project
- Give an objective assessment of the success of your project workflow and teamwork.
- What worked and what didn't work?
- What would you do differently if you could do it all over again?
- Evaluate your team’s portion of the Final Project and Group Report in the following areas:
- Content: What is the quality of the work?
- Organization: Comment on the organization of the project and of your group's wiki pages.
- Completeness: Did your team achieve all of the project objectives? Why or why not?
Reflection on the Process
- What did you learn?
- With your head (biological or computer science principles)
- With your heart (personal qualities and teamwork qualities that make things work or not work)?
- With your hands (technical skills)?
- What lesson will you take away from this project that you will still use a year from now?