Bklein7 Week 7
From LMU BioDB 2015
Contents
Introduction to DNA Microarrays
Discovery Questions from Campbell & Heyer Chapter 4
Answer the following questions related to Chapter 4 of Campbell & Heyer (2003). Note that some of the questions below have been reworded from the Discovery Questions in the book:
- (Question 5, p. 110) Choose two genes from Figure 4.6b (PDF of figures on MyLMUConnect) and draw a graph to represent the change in transcription over time. You can either create your plot in Excel and put the image up on your wiki page or you can do it in hard copy and turn it in in class.
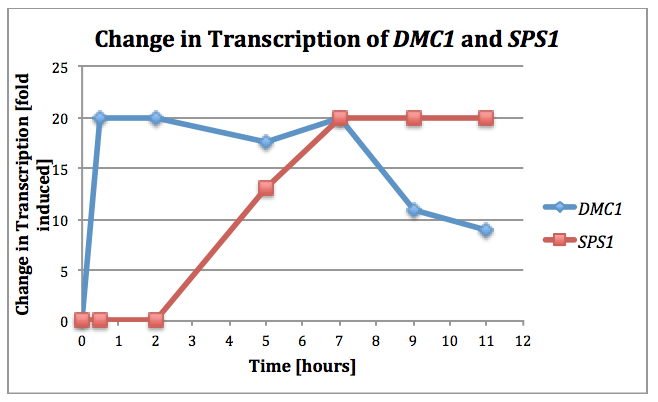
- Disclaimer: I am red-green colorblind, so assessing the red-green color scale for changes in transcription (Figure 4.5) proved difficult. In correlating the colors from Figure 4.6b to values, I made my best guesses using the aid of pixel color analysis tools.
- (Question 6b, p. 110) Look at Figure 4.7, which depicts the loss of oxygen over time and the transcriptional response of three genes. These data are the ratios of transcription for genes X, Y, and Z during the depletion of oxygen. Using the color scale from Figure 4.6, determine the color for each ratio in Figure 4.7b. (Use the nomenclature "bright green", "medium green", "dim green", "black", "dim red", "medium red", or "bright red" for your answers.)
- (Question 7, p. 110) Were any of the genes in Figure 4.7b transcribed similarly? If so, which ones were transcribed similarly to which ones?
- The transcription of genes X and Y from Figure 4.7b exhibited similar patterns in response to the gradual loss of oxygen. The transcription of both genes was induced at the 3 hour mark (90% of normal oxygen level), showed very little or no change when compared to the control at the 5 hour mark (~62% of normal oxygen level), and finally was repressed at the 9 hour mark (10% of normal oxygen level). Despite these similar patterns of up and down-regulation, the magnitudes of the transcriptional changes did vary between the two genes. Gene Y was both more dramatically induced at the 3 hour mark and more dramatically repressed at the 9 hour mark. Additionally, gene Y was very slightly down-regulated at the 5 hour mark whereas gene X showed no change from its transcription at a normal oxygen level.
- (Question 9, p. 118) Why would most spots be yellow at the first time point? I.e., what is the technical reason that spots show up as yellow - where does the yellow color come from? And, what would be the biological reason that the experiment resulted in most spots being yellow?
- At the first time point, the experimental group was the least glucose-limited when compared to all other time points, and therefore these experimental conditions were most similar to that of the control (glucose rich environment). Spots on a DNA microarray appear yellow when approximately equal amounts of cDNA from the control group, labelled green, and the experimental group, labelled red, bind to a specific spot. Thus, yellow spots indicate no change in the transcription rates of genes when comparing the experimental and control groups. Because the first time point was the time at which the experimental conditions best matched the control conditions (little/no glucose limitation), there consequentially was very little transcriptional change, resulting in most spots being yellow.
- (Question 10, p. 118) Go to the Saccharomyces Genome Database and search for the gene TEF4; you will see it is involved in translation. Look at the time point labeled OD 3.7 in Figure 4.12, and find the TEF4 spot. Over the course of this experiment, was TEF4 induced or repressed? Hypothesize why TEF4’s change in expression was part of the cell’s response to a reduction in available glucose (i.e., the only available food).
- According to the Saccharomyces Genome Database, TEF4 is a transcription elongation factor that stimulates the binding of AA-tRNA to ribosomes. Thus, the translation of the TEF4 gene induces protein production. In reviewing the DNA microarray results in Figure 4.12, TEF4 is repressed by OD 0.46, transcribed at rates consistent with the control by OD 0.8, and then increasingly repressed over the remainder of the experiment. The time marked by OD 0.46 is associated with the onset of glucose limitation. It is possible that the yeast detect this initial decrease in available chemical energy (as glucose is necessary for glycolysis and consequentially the production of ATP), and they respond by down-regulating protein production genes to conserve chemical energy. In this sense, the cell would essentially be preparing for a possible energy deficit. At OD 0.8, when the glucose levels had only slowly decreased, the yeast cells may have terminated this seemingly aggressive response to potential energy deficiency. However, when the environment became more dramatically glucose-limited, the cells resumed the strategy of conserving chemical energy by decreasing protein production. By the time the environment was almost entirely devoid of glucose, TEF4 experienced over a 20 fold repression. This suggests that protein production was dramatically limited to endeavor to preserve the cell's life as long as possible before glucose levels could be restored. The trend of down-regulating protein producing genes in a glucose-limited environment is supported by Figure 4.13.
- (Question, 11, p. 120) Why would TCA cycle genes be induced if the glucose supply is running out?
- Saccharomyces cerevisiae releases chemical energy from glucose through anaerobic respiration (fermentation) in glucose-rich environments, despite it being the energetically inefficient pathway when compared to aerobic respiration. However, in glucose-limited environments, yeast cells switch to the aerobic pathway. Upon switching pathways, ethanol is converted to acetyl-CoA, which enters the TCA cycle (aerobic pathway), and glucose is converted into storage sugars. This diauxic shift is captured in the microarray experiment. In the glucose-limited experimental group, TCA cycle genes are induced to shift from fermentation to the aerobic respiration pathway. This shift happens in response to glucose depletion, because it enables the cell to produce more ATP through the more energetically productive TCA cycle and conserve glucose. Thus, the cell is essentially preparing for survival in a glucose-limited environment by freeing up higher levels of chemical energy to sustain cellular processes and storing glucose for emergency use.
- (Question 12, p. 120) What mechanism could the genome use to ensure genes for enzymes in a common pathway are induced or repressed simultaneously?
- The genome could induce or repress genes in a common pathway simultaneously if the different genes all contained equivalent regulatory sequences in their promotor regions that bound to the same regulatory protein (transcription factor). In this case, the transcription factor would have be specific in that it only would act on genes present in that pathway (or associated processes). If so, genes involved in the same pathway could be regulated by controlling the synthesis of just one protein, regardless of their diverse positions in the genome.
- (Question 13, p. 121) Consider a microarray experiment where cells deleted for the repressor TUP1 were subjected to the same experiment of a timecourse of glucose depletion where cells at t0 (plenty of glucose available) are labeled green and cells at later timepoints (glucose depleted) are labeled red. What color would you expect the spots that represented glucose-repressed genes to be in the later time points of this experiment?
- TUP1p is one of the several repressor proteins that down-regulate glucose-repressed genes in the presence of glucose. In a ∆TUP1 mutant, the TUP1 gene would never be translated, and therefore no TUP1p would be present in the cell. In the absence of this repressor protein, the glucose-repressed genes it impacts would be less dramatically down-regulated, or simply not down-regulated at all if they were solely repressed by TUP1p, in the presence of glucose. Therefore, glucose-repressed genes would be translated at higher than normal rates at t0 and subsequently become exceedingly induced as any lingering repression subsided over the course of the experiment. Thus, glucose-repressed genes that are repressed only by TUP1p would have yellow spots, and glucose-repressed genes that were repressed by other proteins as well would have red spots at the later time points.
- (Question 14, p. 121) Consider a microarray experiment where cells that overexpress the transcription factor Yap1p were subjected to the same experiment of a timecourse of glucose depletion where cells at t0 (plenty of glucose available) are labeled green and cells at later timepoints (glucose depleted) are labeled red. What color would you expect the spots that represented Yap1p target genes to be in the later time points of this experiment?
- YAP1p is a transcription factor that is known to confer resistance to environmental stress. Therefore, this transcription factor must induce the transcription of genes that confer resistance to environmental stress such as glucose depletion. In a mutant where YAP1 is overexpressed, yeast cells will have abnormally high levels of YAP1p, which in turn will activate the target genes of YAP1 that confer environmental resistance. Thus, genes that respond to glucose-depletion will be active already at t0. In early stages of glucose depletion, the cell will be largely resistant to this stress and up-regulation of YAP1's target genes will occur little if at all, resulting in yellow and red spots. At later time points, the cell will begin to be stressed by the glucose-limited environment and express YAP1 at high rates. This in turn will dramatically induce YAP1's target genes, resulting in relatively bright red spots.
- (Question 16, p. 121) Using the microarray data, how could you verify that you had truly deleted TUP1 or overexpressed YAP1 in the experiments described in questions 8 and 9?
- In the case of the ∆TUP1 mutant, successful deletion of TUP1 would result in the absence of any TUP1 transcription products in the cell. Therefore, no cDNA would be created in the experiment that would bind to the TUP1 spot. This spot would consequentially be black, the sign of an inactive gene (as it was deleted).
- In the case of the YAP1 overexpression mutant, the expression of YAP1 in response to environmental stress over the course of the experiment would be amplified. Consequentially, YAP1 would be induced at a very high rate by the end of the experiment, resulting in the YAP1 spot being bright red during later time points. A different way to verify that YAP1 was overexpressed would be to assess the transcription rates of YAP1's target genes over the course of the experiment. If they remained yellow after initial glucose depletion, then YAP1p was present in higher than normal rates in the cell, indicating an overexpression mutant. If the spots immediately turned red after the initial glucose depletion, this would indicate the normal response of YAP1 (i.e. that a mutant was not created).


Links
- User Page: Brandon Klein
- Team Page: The Class Whoopers
Assignments Pages
- Week 1 Assignment
- Week 2 Assignment
- Week 3 Assignment
- Week 4 Assignment
- Week 5 Assignment
- Week 6 Assignment
- Week 7 Assignment
- Week 8 Assignment
- Week 9 Assignment
- Week 10 Assignment
- Week 11 Assignment
- Week 12 Assignment
- No Week 13 Assignment
- Week 14 Assignment
- Week 15 Assignment
Individual Journal Entries
- Week 1 Individual Journal
- Week 2 Individual Journal
- Week 3 Individual Journal
- Week 4 Individual Journal
- Week 5 Individual Journal
- Week 6 Individual Journal
- Week 7 Individual Journal
- Week 8 Individual Journal
- Week 9 Individual Journal
- Week 10 Individual Journal
- Week 11 Individual Journal
- Week 12 Individual Journal
- No Week 13 Journal
- Week 14 Individual Journal
- Week 15 Individual Journal
- Week 1 Class Journal
- Week 2 Class Journal
- Week 3 Class Journal
- Week 4 Class Journal
- Week 5 Class Journal
- Week 6 Class Journal
- Week 7 Class Journal
- Week 8 Class Journal
- Week 9 Class Journal
- Week 10 Team Journal
- Week 11 Team Journal
- Week 12 Team Journal
- No Week 13 Journal
- Week 14 Team Journal
- Week 15 Team Journal