Difference between revisions of "Mbalducc Week 6"
From LMU BioDB 2017
(added response) |
(added references) |
||
| Line 5: | Line 5: | ||
# | # | ||
| + | = Acknowledgements = | ||
| − | + | = References = | |
| + | LMU BioDB 2017. (2017). Week 6. Retrieved October 6, 2017, from https://xmlpipedb.cs.lmu.edu/biodb/fall2017/index.php/Week_6 | ||
{{template:mbalducc}} | {{template:mbalducc}} | ||
Revision as of 16:51, 6 October 2017
Contents
Discovery Questions Responses
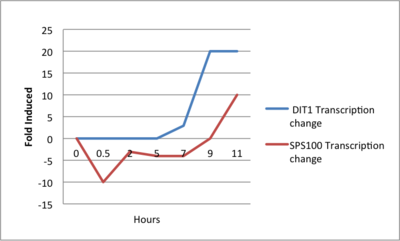
- Here is the graph I created of two genes, DIT1 and SPS100 and their transcription rates over time.
- Gene X: 1 hour: Black, 3 hours: Dark Red, 5 hours: Black, 9 hours: Dark Green. Gene Y: 1 hour: Black, 3 hours: Red, 5 hours: Black, 9 hours: Dark Green. Gene Z: 1 hour: Black, 3 hours: Black, 5 hours: Dark Red, 9 hours: Dark red.
- Gene X and Gene Y transcribed similarly. They both increased in the first 3 hours, then came back down to about a 1:1 ratio, then reduced transcription to 0.15-0.05.

Acknowledgements
References
LMU BioDB 2017. (2017). Week 6. Retrieved October 6, 2017, from https://xmlpipedb.cs.lmu.edu/biodb/fall2017/index.php/Week_6
Other Pages
Individual Journals
No Assignment Week 13
Assignments
No Assignment Week 13