Difference between revisions of "Mbalducc Week 6"
From LMU BioDB 2017
(added references) |
(added references) |
||
| Line 3: | Line 3: | ||
#'''Gene X''': 1 hour: Black, 3 hours: Dark Red, 5 hours: Black, 9 hours: Dark Green. '''Gene Y''': 1 hour: Black, 3 hours: Red, 5 hours: Black, 9 hours: Dark Green. '''Gene Z''': 1 hour: Black, 3 hours: Black, 5 hours: Dark Red, 9 hours: Dark red. | #'''Gene X''': 1 hour: Black, 3 hours: Dark Red, 5 hours: Black, 9 hours: Dark Green. '''Gene Y''': 1 hour: Black, 3 hours: Red, 5 hours: Black, 9 hours: Dark Green. '''Gene Z''': 1 hour: Black, 3 hours: Black, 5 hours: Dark Red, 9 hours: Dark red. | ||
#Gene X and Gene Y transcribed similarly. They both increased in the first 3 hours, then came back down to about a 1:1 ratio, then reduced transcription to 0.15-0.05. | #Gene X and Gene Y transcribed similarly. They both increased in the first 3 hours, then came back down to about a 1:1 ratio, then reduced transcription to 0.15-0.05. | ||
| − | # | + | #The spots would be yellow at the first time point because they have both the red and green dyes, they have not had a chance to transcribe based on oxygen or not yet. The yellow comes from the mix of red and green dyes because of the 1:1 ratio of each gene. The biological reason that most spots resulted in being yellow would be that the same gene is transcribed whether or not oxygen is present. |
| + | #Over the course of the experiment, the TEF4 was repressed. This could have happened due to the lack of glucose, which is necessary for | ||
= Acknowledgements = | = Acknowledgements = | ||
| Line 9: | Line 10: | ||
= References = | = References = | ||
LMU BioDB 2017. (2017). Week 6. Retrieved October 6, 2017, from https://xmlpipedb.cs.lmu.edu/biodb/fall2017/index.php/Week_6 | LMU BioDB 2017. (2017). Week 6. Retrieved October 6, 2017, from https://xmlpipedb.cs.lmu.edu/biodb/fall2017/index.php/Week_6 | ||
| + | |||
| + | SGD. (2017). TEF4 / YKL081W Overview. Retrieved October 9, 2017 from https://www.yeastgenome.org/locus/S000001564 | ||
{{template:mbalducc}} | {{template:mbalducc}} | ||
Revision as of 16:32, 9 October 2017
Contents
Discovery Questions Responses
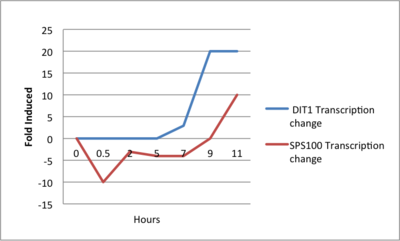
- Here is the graph I created of two genes, DIT1 and SPS100 and their transcription rates over time.
- Gene X: 1 hour: Black, 3 hours: Dark Red, 5 hours: Black, 9 hours: Dark Green. Gene Y: 1 hour: Black, 3 hours: Red, 5 hours: Black, 9 hours: Dark Green. Gene Z: 1 hour: Black, 3 hours: Black, 5 hours: Dark Red, 9 hours: Dark red.
- Gene X and Gene Y transcribed similarly. They both increased in the first 3 hours, then came back down to about a 1:1 ratio, then reduced transcription to 0.15-0.05.
- The spots would be yellow at the first time point because they have both the red and green dyes, they have not had a chance to transcribe based on oxygen or not yet. The yellow comes from the mix of red and green dyes because of the 1:1 ratio of each gene. The biological reason that most spots resulted in being yellow would be that the same gene is transcribed whether or not oxygen is present.
- Over the course of the experiment, the TEF4 was repressed. This could have happened due to the lack of glucose, which is necessary for

Acknowledgements
References
LMU BioDB 2017. (2017). Week 6. Retrieved October 6, 2017, from https://xmlpipedb.cs.lmu.edu/biodb/fall2017/index.php/Week_6
SGD. (2017). TEF4 / YKL081W Overview. Retrieved October 9, 2017 from https://www.yeastgenome.org/locus/S000001564
Other Pages
Individual Journals
No Assignment Week 13
Assignments
No Assignment Week 13