Mbalducc Week 6
From LMU BioDB 2017
Contents
Discovery Questions Responses
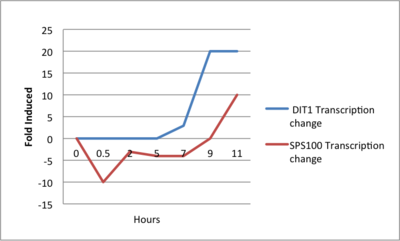
- Here is the graph I created of two genes, DIT1 and SPS100 and their transcription rates over time.
- Gene X: 1 hour: Black, 3 hours: Dark Red, 5 hours: Black, 9 hours: Dark Green. Gene Y: 1 hour: Black, 3 hours: Red, 5 hours: Black, 9 hours: Dark Green. Gene Z: 1 hour: Black, 3 hours: Black, 5 hours: Dark Red, 9 hours: Dark red.
- Gene X and Gene Y transcribed similarly. They both increased in the first 3 hours, then came back down to about a 1:1 ratio, then reduced transcription to 0.15-0.05.

Other Pages
Individual Journals
No Assignment Week 13
Assignments
No Assignment Week 13