Difference between revisions of "Msamdars Week 6"
Jump to navigation
Jump to search
(→Questions) |
(→Questions: add responses to first few qs) |
||
| Line 13: | Line 13: | ||
<ul> | <ul> | ||
<li> | <li> | ||
| − | {| class="wikitable" | + | {| class="wikitable" style="text-align: center;" |
! colspan="1" | | ! colspan="1" | | ||
! colspan="5" | Timepoint | ! colspan="5" | Timepoint | ||
|- | |- | ||
| − | ! scope="col"| Genes | + | ! scope="col" | Genes |
! scope="col"| 1 hour | ! scope="col"| 1 hour | ||
! scope="col"| 3 hour | ! scope="col"| 3 hour | ||
| Line 47: | Line 47: | ||
<li> Were any of the genes in Figure 4.7b transcribed similarly? If so, which ones were transcribed similarly to which ones?</li> | <li> Were any of the genes in Figure 4.7b transcribed similarly? If so, which ones were transcribed similarly to which ones?</li> | ||
<ul> | <ul> | ||
| − | <li> | + | <li>Gene X followed a similar transcription pattern as Gene Y. Both were measured as having an early heavy spike in transcription rates at the 4 hour timepoints, returned to near baseline rates at the 5 hour timepoints, and a substantial reduction in transcription rates at the 9 hour timepoints, with gene Y being more exaggerated than gene X in displaying these patterns.</li> |
| − | </li> | ||
</ul> | </ul> | ||
<li> Why would most spots be yellow at the first time point? I.e., what is the technical reason that spots show up as yellow - where does the yellow color come from? And, what would be the biological reason that the experiment resulted in most spots being yellow?</li> | <li> Why would most spots be yellow at the first time point? I.e., what is the technical reason that spots show up as yellow - where does the yellow color come from? And, what would be the biological reason that the experiment resulted in most spots being yellow?</li> | ||
Revision as of 23:52, 8 October 2019
Contents
Electronic Lab Notebook
Purpose
The purpose of this assignment is for us to understand how DNA microarray experiments work, and how to analyze the data that we gather from these microarray experiments.
Questions
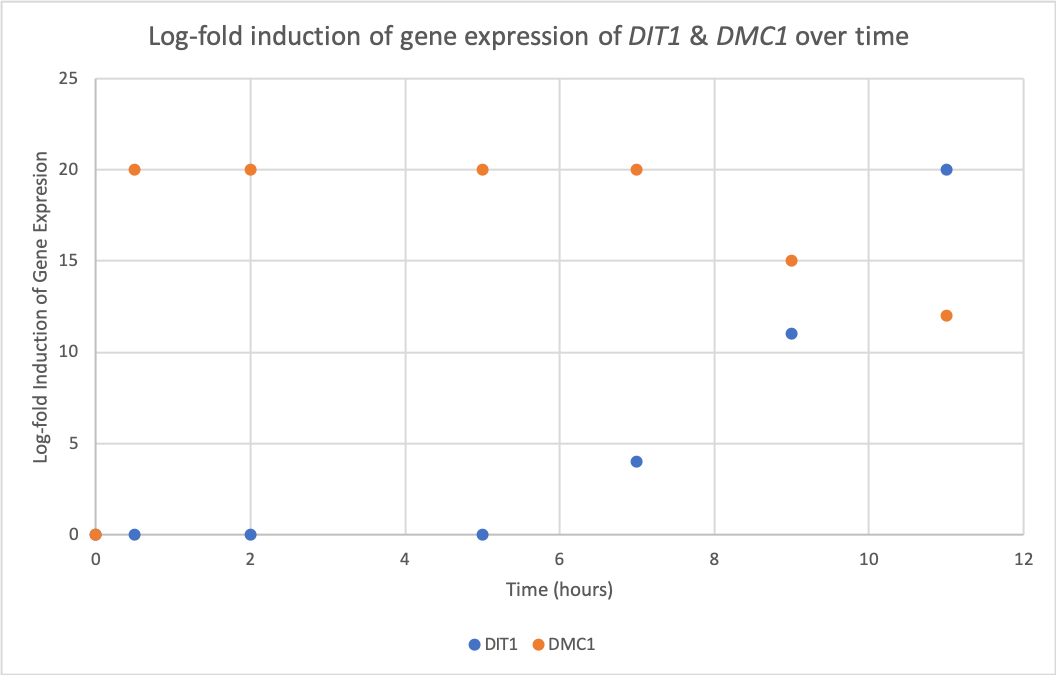
- Choose two genes from Figure 4.6b and draw a graph to represent the change in transcription over time. You can either create your plot in Excel and put the image up on your wiki page or you can do it by hand and upload a picture or scan.
-
- Look at Figure 4.7, which depicts the loss of oxygen over time and the transcriptional response of three genes. These data are the ratios of transcription for genes X, Y, and Z during the depletion of oxygen. Using the color scale from Figure 4.6, determine the color for each ratio in Figure 4.7b.
-
Timepoint Genes 1 hour 3 hour 5 hour 9 hour gene X black medium red black bright green gene Y black bright red black bright green gene Z black dim red medium red medium red - Were any of the genes in Figure 4.7b transcribed similarly? If so, which ones were transcribed similarly to which ones?
- Gene X followed a similar transcription pattern as Gene Y. Both were measured as having an early heavy spike in transcription rates at the 4 hour timepoints, returned to near baseline rates at the 5 hour timepoints, and a substantial reduction in transcription rates at the 9 hour timepoints, with gene Y being more exaggerated than gene X in displaying these patterns.
- Why would most spots be yellow at the first time point? I.e., what is the technical reason that spots show up as yellow - where does the yellow color come from? And, what would be the biological reason that the experiment resulted in most spots being yellow?
- Go to the Saccharomyces Genome Database and search for the gene TEF4; you will see it is involved in translation. Look at the time point labeled OD 3.7 in Figure 4.12, and find the TEF4 spot. Over the course of this experiment, was TEF4 induced or repressed? Hypothesize why TEF4’s change in expression was part of the cell’s response to a reduction in available glucose (i.e., the only available food).
- Why would TCA cycle genes be induced if the glucose supply is running out?
- What mechanism could the genome use to ensure genes for enzymes in a common pathway are induced or repressed simultaneously?
- Consider a microarray experiment where cells deleted for the repressor TUP1 were subjected to the same experiment of a timecourse of glucose depletion where cells at t0 (plenty of glucose available) are labeled green and cells at later timepoints (glucose depleted) are labeled red. What color would you expect the spots that represented glucose-repressed genes to be in the later time points of this experiment?
- Consider a microarray experiment where cells that overexpress the transcription factor Yap1p were subjected to the same experiment of a timecourse of glucose depletion where cells at t0 (plenty of glucose available) are labeled green and cells at later timepoints (glucose depleted) are labeled red. What color would you expect the spots that represented Yap1p target genes to be in the later time points of this experiment?
- Using the microarray data, how could you verify that you had truly deleted TUP1 or overexpressed YAP1 in the experiments described in questions 8 and 9?

Acknowledgements
This week my partner was Christina Dominguez. We worked in class together.
Except for what is noted above, this individual journal entry was completed by me and not copied from another source.
Other Links
| Links | ||
|---|---|---|
| Mihir Samdarshi User Page | ||
| Assignment Pages | Personal Journal Entries | Shared Journal Entries |
| Week 1 | Journal Week 1 | Class Journal Week 1 |
| Week 2 | Journal Week 2 | Class Journal Week 2 |
| Week 3 | FAS2/YPL231W Week 3 | Class Journal Week 3 |
| Week 4 | Journal Week 4 | Class Journal Week 4 |
| Week 5 | Database - AmtDB | Class Journal Week 5 |
| Week 6 | Journal Week 6 | Class Journal Week 6 |
| Week 7 | Journal Week 7 | Class Journal Week 7 |
| Week 8 | Journal Week 8 | Class Journal Week 8 |
| Week 9 | Journal Week 9 | Class Journal Week 9 |
| Assignment Pages | Personal Journal Entries | |
| Week 10 | Journal Week 10 | |
| Week 11 | Journal Week 11 | |
| Week 12/13 | Journal Week 12/13 | |
| Team Project Links | ||
| Skinny Genes Team Page | ||
References
- LMU BioDB 2019. (2019). Week 6. Retrieved October 8, 2019, from https://xmlpipedb.cs.lmu.edu/biodb/fall2019/index.php/Week_6
- MediaWiki (2019). Category: Help. Retrieved October 8, 2019, from https://www.mediawiki.org/wiki/Category:Help