Difference between revisions of "Asandle1 Week 10"
(→Methods/Results/Electronic Notebook: Moving the location of GRNmap section) |
(→Creating the GRNmap Input Workbook: adding section) |
||
| Line 158: | Line 158: | ||
| − | === | + | ===GRNsight, creating and visualizing the GRN=== |
| + | |||
| + | 1) | ||
=Data and Files= | =Data and Files= | ||
Revision as of 15:31, 1 April 2024
Methods/Results/Electronic Notebook
Purpose
The purpose of this assignment is to get experience with the analysis part of the "data life cycle" for DNA microarray datasets and to "develop an intuition about different p-value cut-offs and their meanings.
It also is to show how to keep a detailed electronic lab notebook to make our research reproducible to develop an intuition about what different p-value cut-offs mean.
Methods/Electronic Notebook
Part 1: Data Setup and STEM Installation
1) I inserted a new worksheet into my Excel workbook and named it dGLN3_stem.
2) Selected all of the data from my dGLN3_ANOVA worksheet and pasted it as values into my new dGLN3_stem worksheet.
3) Renamed my left MasterIndex column to SPOT
4) Renamed Column B to "Gene Symbol".
5) Deleted the column named "Standard_Name".
6) Filtered the data on the B-H corrected p value to be > 0.05.
7) Selected all of the rows (except for the header) and deleted the rows by right-clicking and choosing "Delete Row" from the context menu.
8)Undid the filter.
9) Deleted all of the data columns EXCEPT for the Average Log Fold change columns for each timepoint (for example, wt_AvgLogFC_t15, etc.).
10) Helped Charlotte Kaplan do the same filtering step. She had a small issue where she deleted the data on the rows but not the rows.
11) Renamed the data columns with just the time and units (for example, 15m, 30m, etc.).
12) Helped Charlotte with Pasting Values.
13) There were some #DIV/0! errors. To fix, I am opening the Find/Replace dialog and searching for the DIV errors by #DIV/0!.
14) It removed 110 DIV/0’s.
15) Saved my work. Then used Save As to save it as .txt file.
16) I did not turn on file extensions because I am on a mac and it shows me already.
17) Tried to download the Stem software on mac but it was not a quick process so I moved to the Windows computer.
18) I used Box to upload the spreadsheet that I saved as a text file.
19) I downloaded the text file onto the windows computer.
20) I extracted it.
21) Dr. Dahlquist helped me turn on file extensions.
22) I downloaded and extracted the STEM software onto the computer.
23) I downloaded the Gene Ontology file gene_ontology.obo from https://lmu.box.com/s/t8i5s1z1munrcfxzzs7nv7q2edsktxgl
24) I downloaded the gene_association.sgd.gz file from https://lmu.box.com/s/zlr1s8fjogfssa1wl59d5shyybtm1d49
25) I put the files into the STEM folder that was created when I extracted all from the Stem.zip earlier.
Part 2: Using STEM
1) I double clicked on stem.jar to run the program
2) STEM opened into the main interface window and I clicked on the Browse button to navigate to my file AS&CK_BIOL367_STEM.txt and selected it.
3) I clicked on the button that says No normalization/add 0.
4) I clicked on the box next to Spot IDs included in the data file.
5) I did not make any changes to the default selection for the three drop-down menu selections for Gene Annotation Source, Cross Reference Source, and Gene Location Source. They are all still set as "User Provided".
6) I clicked the Browse button on the right of the "Gene Annotation File" item.
7) I looked in the "stem" folder and selected the file called "gene_association.sdg.gz" which I had previously downloaded and put into the "stem" folder.
8) In the third section of the STEM GUI in the main STEM window, I made sure to check that the Clustering Method said, "STEM Clustering Method" and I did not change the defaults for the Maximum Number of Model Profiles or Maximum Unit Change in Model Profiles between Time Points.
9) I selected the yellow Execute button to run STEM. There were no errors and it ran successfully.
10) A new window opened that is called "All STEM Profiles (1)".
11) I clicked on a button that said "Interface Options...". There was a window that appeared below the text "X-axis scale should be:"
12) I clicked on the radio button that said "Based on real time".
13) I closed the interface options window.
14) I took a screenshot of the window by clicking the Alt and PrintScreen buttons at the same time.
15) I opened a powerpoint
16) I pasted the screenshot into powerpoint.
17) I clicked on each of the SIGNIFICANT profiles which are the colored images one at a time to show a more detailed plot that had all the genes for a specific profile.
18) I took screenshots of each of these and pasted them one by one into the powerpoint document I created.
19) I was supposed to then complete this step: * At the bottom of each profile window, there are two yellow buttons "Profile Gene Table" and "Profile GO Table". For each of the profiles, click on the "Profile Gene Table" button to see the list of genes belonging to the profile. In the window that appears, click on the "Save Table" button and save the file to your desktop. Make your filename descriptive of the contents, e.g. "wt_profile#_genelist.txt", where you replace the number symbol with the actual profile number.
I did not complete this step.
20) I added my journal entry to the wiki
21) I emailed Dr. Dahlquist about the missed step to see what I should do.
22) Uploading just the powerpoint for now since I am waiting to hear back about the other files.
23) Repeated the steps exactly for the STEM software. This time, I downloaded the Profile Gene Table and Profile GO Table.
24) I followed the labeling conventions... (Will check files to be sure)
25) I labeled my files so that they are clear and easy to know which file is which. I zipped them together. The file is named Andrew Tables Gene/Go Data.zip
26) The files in the zip are named dGLN3 #(whatever number they are) Go Table or Gene Table. We did not save one of these, and so I included a folder to remind that #45 Gene Table is missing. We used the output data from the table and the visual included in our powerpoint
Analysis of STEM Results
1) Select a profile of a gene you found interesting. Why?
I find profile 9 really interesting because I wonder why it went down in expression at first but then up in expression as it continued.
2) How many genes belong to this profile?
3) How many genes were expected to belong to this profile?
4) What is the p value for the enrichment of genes in this profile?
5)
Using YEASTRACT to infer which TF's regulate a cluster of genes
1) I opened the gene list for #9 and copied the gene ID's onto my clipboard.
2) I launched the browser and went to the YEASTRACT database by typing in www.yeastract.com. I did not click on the link because I was not signed in on the class website on the class computer.
3)I selected Rank by Tf and pasted my list of genes from my cluster into the box labeled ORFs/Genes.
4) I checked the box that said Check for all TFs and accepted the defaulted for the regulations filter (Documented, DNA binding or expression evidence)
5) I did not apply a filter for the "Filter Documented Regulations by environmental condition" option.
6) I ranked genes by TF using: The % of genes in the list and in YEASTRACT regulated by each TF.
7) I clicked on the Search button.
8) In the results window that appears, the p values colored green are considered "significant", the yellow ones are "borderline significant", and the pink ones are "not significant". How many TF's are green or significant?
9)
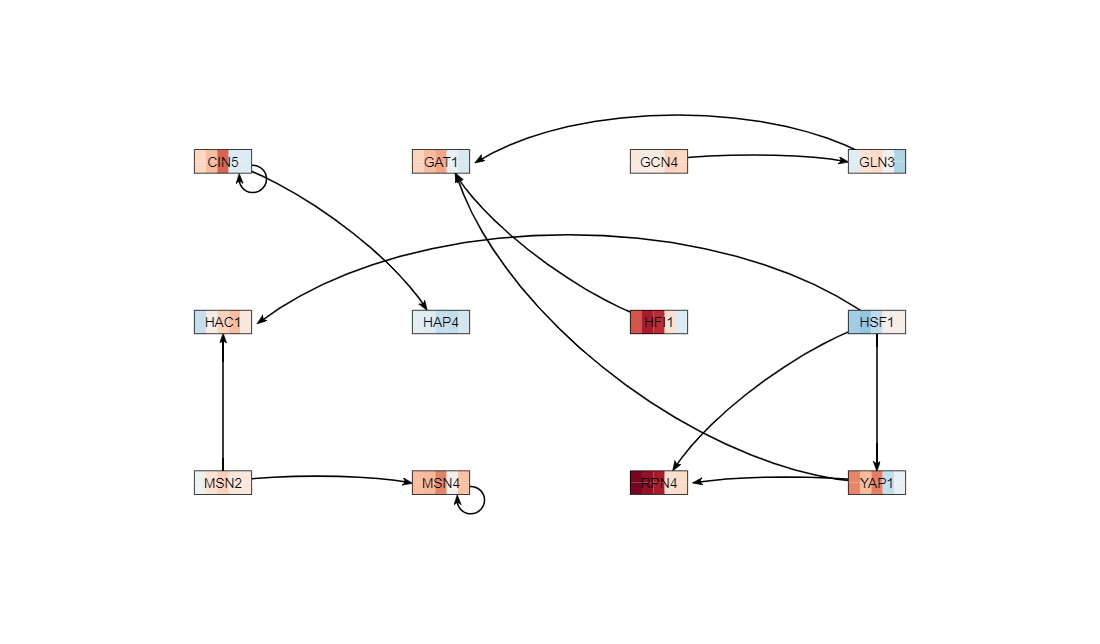
GRNsight, creating and visualizing the GRN
1)
Data and Files
Media:AS&CK_BIOL367_S24_STEM_PHOTOS_dGLN3.pptx
Media:Andrew&Charlotte_Tables_Gene-GoData.zip
Media:Asandle1YeastractResults9.xlsx
Media:AndrewGRN(Yeastmine_-_SGD___2022-03-07;12_genes,_13_edges).png
Media:GRN(Yeastmine_-_SGD_2022-03-07;12_genes,_13_edges)_weighted.xlsx
Acknowledgements & References
Acknowledgments
- I worked on this assignment with Charlotte Kaplan in class. I helped her with a lot of her excel stuff because I had more experience. I texted her at 5:57 pm on wednesday about the p-values for B&H being strangely low for me. For the most part I did the assignment on my own and really was helping her catch up to me.
- Dr. Dahlquist was very helpful in class when I ran into some errors with the data. The specific errors are in the electronic notebook.
- I used the Week 9 instructions and followed them.
- Except for what is noted above, this individual journal entry was completed by me and not copied from another source.
18:04, 20 March 2024 (PDT)
References
- Dahlquist, K. Master_sheet_dGLN3.
- LMU BioDB 2024. (2024). Week 9. Retrieved Mar 20, 2024, from https://xmlpipedb.cs.lmu.edu/biodb/Spring2024/index.php/Week_9
To User Page: User: Asandle1
To Template: Template:Asandle1