Difference between revisions of "Ckaplan Week 10"
(uploading graphs) |
(creating procedure) |
||
| Line 13: | Line 13: | ||
[[Media:CKgenegraph.jpg]] | [[Media:CKgenegraph.jpg]] | ||
| − | ===Why did you select this profile? In other words, why was it interesting to you?=== | + | ===Procedure:=== |
| + | Prepare Microarray Data for STEM: | ||
| + | I created a new worksheet named "dGln3_stem" in Excel. | ||
| + | I copied data from the "dGln3_ANOVA" worksheet and pasted values into "dGln3_stem". | ||
| + | I renamed columns: "Master_Index" to "SPOT", "ID" to "Gene Symbol", and deleted the column "Standard_Name". | ||
| + | I filtered data on the B-H corrected p value (> 0.05), deleted irrelevant rows, and retained only significant gene expression changes. | ||
| + | I deleted unnecessary columns, leaving only Average Log Fold Change columns for each time point and renamed them. | ||
| + | I removed #DIV/0! errors. | ||
| + | I saved the spreadsheet as Text (Tab-delimited) (*.txt) after turning on file extensions. | ||
| + | Setting up STEM: | ||
| + | I downloaded and extracted the STEM software. | ||
| + | I downloaded the Gene Ontology and yeast GO annotations files and placed them in the STEM folder. | ||
| + | I launched STEM by double-clicking on stem.jar. | ||
| + | In the main STEM interface, I configured settings in sections 1 to 4 as instructed. | ||
| + | I ran STEM by clicking the Execute button. | ||
| + | Viewing and Saving STEM Results: | ||
| + | I reviewed the generated STEM Profiles. | ||
| + | I adjusted the X-axis scale to "Based on real time". | ||
| + | I took screenshots of significant profiles and saved them in a PowerPoint presentation. | ||
| + | I saved gene lists and GO term lists for significant profiles as instructed. | ||
| + | Analyzing STEM Results: | ||
| + | I chose a significant profile with a clear cold shock/recovery pattern. | ||
| + | I examined the number of genes belonging to the profile and the p value for enrichment of genes. | ||
| + | I filtered GO terms based on p values and selected 6 significant terms for further analysis. | ||
| + | I looked up definitions of selected GO terms on the Gene Ontology website. | ||
| + | Using YEASTRACT: | ||
| + | I copied gene IDs from the chosen profile in Excel. | ||
| + | I visited the YEASTRACT database and pasted the gene list. | ||
| + | I ranked genes by TF and noted significant transcription factors. | ||
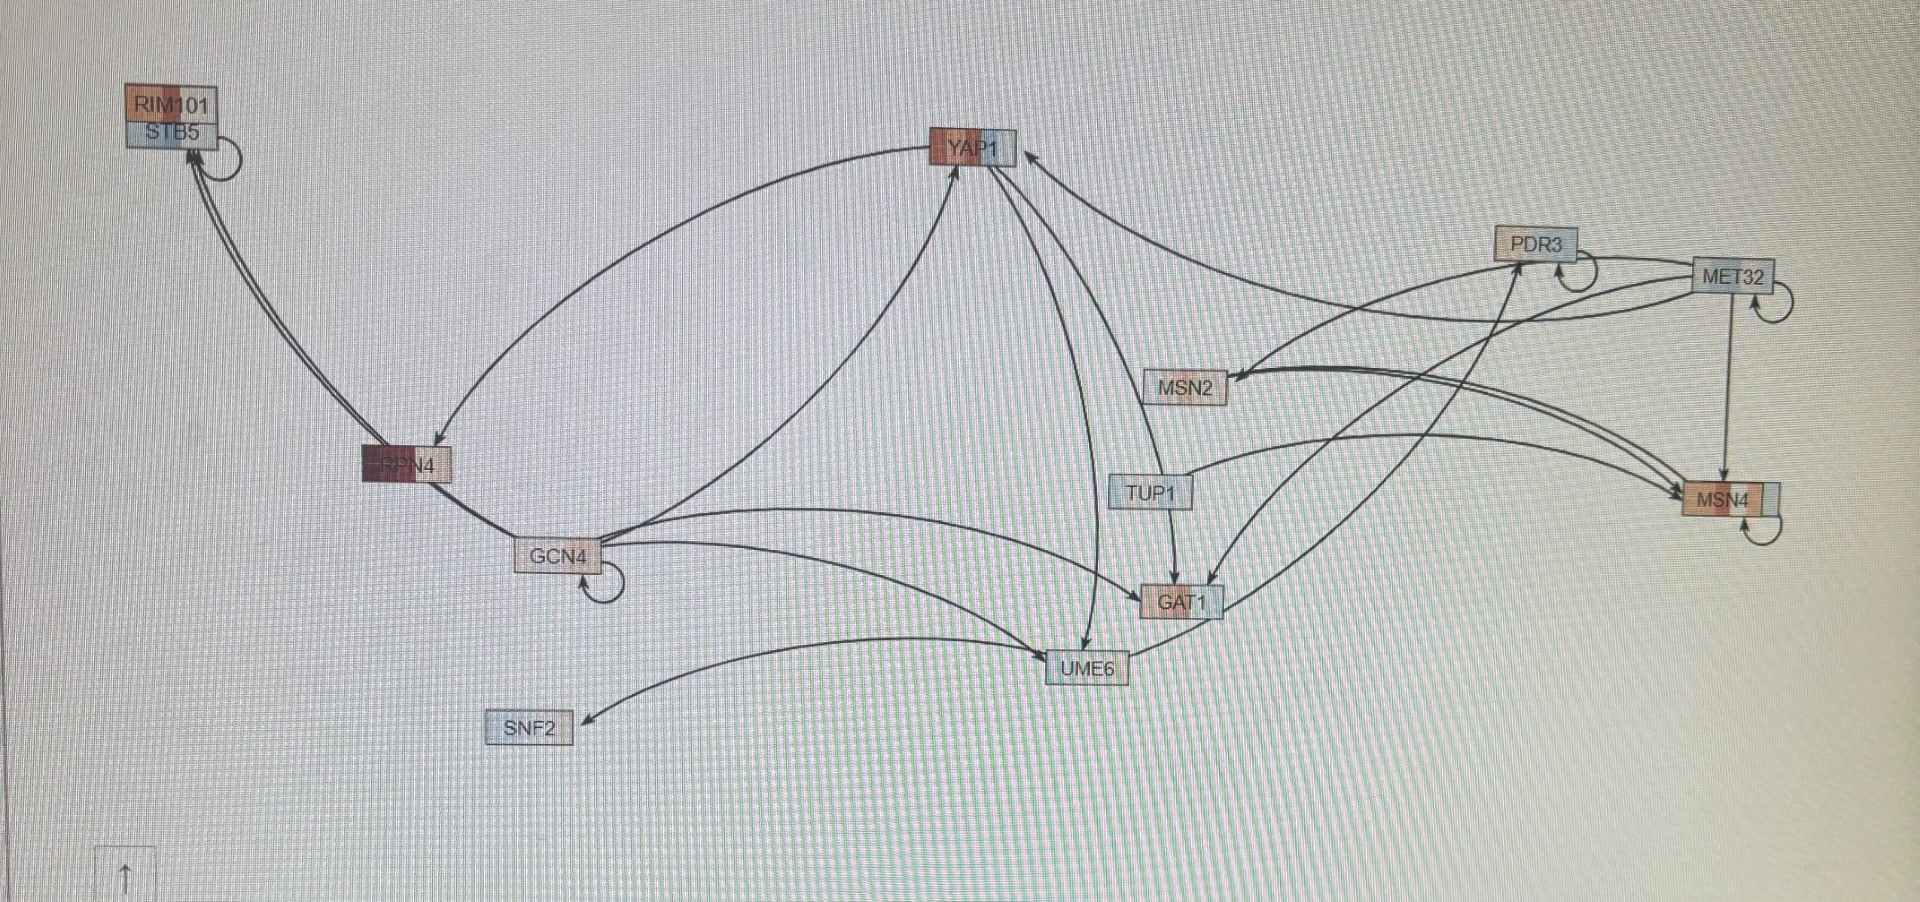
| + | Creating and Visualizing Gene Regulatory Network with GRNsight: | ||
| + | I selected transcription factors from YEASTRACT results, including GLN3. | ||
| + | I loaded the network in GRNsight, ensuring connectivity. | ||
| + | I recorded the number of genes and edges. | ||
| + | I exported the network image as a PNG and uploaded it to the wiki. | ||
| + | Creating GRNmap Input Workbook: | ||
| + | I exported data from GRNsight to Excel. | ||
| + | I checked sheets for correctness, ensuring adjacency matrix, log2 fold changes, and other parameters. | ||
| + | I inserted a new worksheet named "network_weights" and copied the network data. | ||
| + | I adjusted optimization parameters as instructed. | ||
| + | I saved and uploaded the Excel Workbook to the wiki. | ||
| + | |||
| + | *Why did you select this profile? In other words, why was it interesting to you?=== | ||
I selected profile 45 because I thought it was interesting because out of all off our profiles, it had the most genes. | I selected profile 45 because I thought it was interesting because out of all off our profiles, it had the most genes. | ||
| − | + | *How many genes belong to this profile?=== | |
406 | 406 | ||
| − | + | *How many genes were expected to belong to this profile?=== | |
29.9 | 29.9 | ||
| − | + | *What is the p value for the enrichment of genes in this profile?=== | |
0.00 | 0.00 | ||
Revision as of 16:50, 31 March 2024
Media: BIOL367_S24_microarray-data_dGLN3CKAS31211.xlsx
Media:Updated_Pvalues_ckaplan.pdf
Media:Andrew&Charlotte_Tables_Gene-GoData.zip
Media:AS&CK_BIOL367_S24_STEM_PHOTOS_dGLN3.pptx
Media:Yeastract_45_Gene_CK.xlsx
Media:GRN_(Yeastmine_-_SGD__2024-03-19;_13_genes,_21_edges)_weighted_(2)_ck_45.xlsx
Contents
Procedure:
Prepare Microarray Data for STEM: I created a new worksheet named "dGln3_stem" in Excel. I copied data from the "dGln3_ANOVA" worksheet and pasted values into "dGln3_stem". I renamed columns: "Master_Index" to "SPOT", "ID" to "Gene Symbol", and deleted the column "Standard_Name". I filtered data on the B-H corrected p value (> 0.05), deleted irrelevant rows, and retained only significant gene expression changes. I deleted unnecessary columns, leaving only Average Log Fold Change columns for each time point and renamed them. I removed #DIV/0! errors. I saved the spreadsheet as Text (Tab-delimited) (*.txt) after turning on file extensions. Setting up STEM: I downloaded and extracted the STEM software. I downloaded the Gene Ontology and yeast GO annotations files and placed them in the STEM folder. I launched STEM by double-clicking on stem.jar. In the main STEM interface, I configured settings in sections 1 to 4 as instructed. I ran STEM by clicking the Execute button. Viewing and Saving STEM Results: I reviewed the generated STEM Profiles. I adjusted the X-axis scale to "Based on real time". I took screenshots of significant profiles and saved them in a PowerPoint presentation. I saved gene lists and GO term lists for significant profiles as instructed. Analyzing STEM Results: I chose a significant profile with a clear cold shock/recovery pattern. I examined the number of genes belonging to the profile and the p value for enrichment of genes. I filtered GO terms based on p values and selected 6 significant terms for further analysis. I looked up definitions of selected GO terms on the Gene Ontology website. Using YEASTRACT: I copied gene IDs from the chosen profile in Excel. I visited the YEASTRACT database and pasted the gene list. I ranked genes by TF and noted significant transcription factors. Creating and Visualizing Gene Regulatory Network with GRNsight: I selected transcription factors from YEASTRACT results, including GLN3. I loaded the network in GRNsight, ensuring connectivity. I recorded the number of genes and edges. I exported the network image as a PNG and uploaded it to the wiki. Creating GRNmap Input Workbook: I exported data from GRNsight to Excel. I checked sheets for correctness, ensuring adjacency matrix, log2 fold changes, and other parameters. I inserted a new worksheet named "network_weights" and copied the network data. I adjusted optimization parameters as instructed. I saved and uploaded the Excel Workbook to the wiki.
- Why did you select this profile? In other words, why was it interesting to you?===
I selected profile 45 because I thought it was interesting because out of all off our profiles, it had the most genes.
- How many genes belong to this profile?===
406
- How many genes were expected to belong to this profile?===
29.9
- What is the p value for the enrichment of genes in this profile?===
0.00
I have 44 green genes
Gln3p 46.65% Cin5p 31.27%
Assignment Pages
- Week 1
- Week 2
- Week 3
- Week 4
- Week 5
- Week 6
- Week 8
- Week 9
- Week 10
- Week 11
- Week 12
- Week 13
- Week 14
- Week 15
Individual Journal Entry Pages
- ckaplan Week 1
- ckaplan Week 2
- SIR2 Week 3
- AgeAnnoMO Week 4
- ckaplan Week 5
- ckaplan Week 6
- ckaplan Week 8
- ckaplan Week 9
- ckaplan Week 10
- ckaplan Week 11
- ckaplan Week 12
- ckaplan Week 13
- ckaplan Week 14
- ckaplan Week 15